
During intraday trading, 90% of traders fail.
The remaining 10% has made a fortune in the process.
Traders will base their profits on different kinds of purposes.
The purposes can be as follows:

One such method is known as intraday trading.
What is Intraday Trading?
- Intraday trading is the buying and selling of stocks on the very same day.
- Intraday trading is done using online trading platforms.
- Suppose a person is willing to buy a stock for a company, then for intraday, you will have to specifically mention “intraday” in the portal of the platform used.
- This will enable the user to buy and sell the same number of stocks in the very same company on the same day before the market closes.
- The main purpose of intraday trading is to earn profits with the movement of the market indices.
- Many traders refer to this as “day trading.”
- Intraday trading is different for all traders.
- Beginners, from average to expert, all have their own set of ideologies for intraday trading.
- Intraday trading is depicted in the following three categories of traders:
Beginners guide to intraday trading:
- Firstly, to start with day trading, you will have to open a Demat account.
- If you are confused regarding where to open your Demat account, you can refer to our blog that is on our website, Trading Fuel:
- When you are new to intraday trading, you will always be told to keep track of the stock market.
- It is also very important to note the right entry and exit points during intraday trading.
- Manifest the key to putting your stop loss so that you will have to bear a minimum loss.
- When you are into day trading, you will also have to choose stocks that are volatile.
- If the stocks are volatile, you can have profits. If there is no movement in stocks, you might find day trading boring.
- The following are the tips for intraday trading for beginners:

You can also refer to the blog regarding the day trading for beginners on our website Trading Fuel:
Intermediate guide to day trading:
- When you get your hands on trading, you begin to delve deeper into it.
- For that, you start learning the charts, go with the technical analysis, and then plan your investments accordingly.
- When you wish to learn the charts, you cannot simply see the images that are in front of you.
- You will need to conduct a technical analysis for this.
- To do technical analysis, you will have to plot different technical indicators on the charts.
- When you do so, you will be able to identify where to take an entry in the stock and where to exit so that you will be able to gain maximum profit.
- Plotting technical indicators on the charts will also help you to visualize where to place your stop-loss.
- There are several technical indicators in the world of stock markets.
- The best ones are as follows:
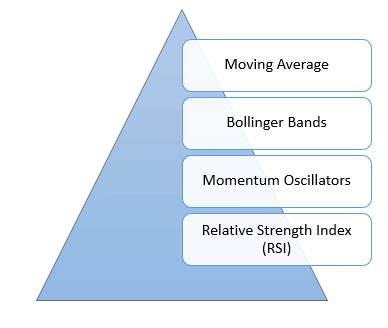
1. Moving Average:
- Most traders tend to rely on the daily moving average of the stocks.
- The MA is the line on the charts that will show the behaviour of the stocks over a period of time.
- These charts will also depict the opening and closing rates of the stock.
- The minimum average line will show the average closing rates of that particular stock in the given interval, and this will help you to comprehend the ups and downs in the price and then determine the flow of the stock.
- The blue line in the below chart is the moving average of the Nifty index:

Know More About:Best EMA for Trading
2. Bollinger Bands:
- Bollinger Bands are the bands that will show the standard deviation of the stock market.
- These bands consist of three lines—the moving average, the upper limit, and the lower limit.
- If you seek the trading range of a particular stock, it will help you to locate the price variation of the stock over a period of time.
- This will also help you to plan your money around the observations.
- The below chart pattern will depict the Bollinger bands:

Know More About:Bollinger Bands
3. Momentum Oscillators:
- Stock prices are considered to be highly volatile.
- Such variations will largely depend on the market situation.
- If a trader wishes to know whether the stock will rise or fall, then he can use the momentum oscillator.
- It will show you the right time to trade and hence will not make you lose your money.
- The below chart will depict the momentum oscillators:

Know More About Indicatore and Oscillator
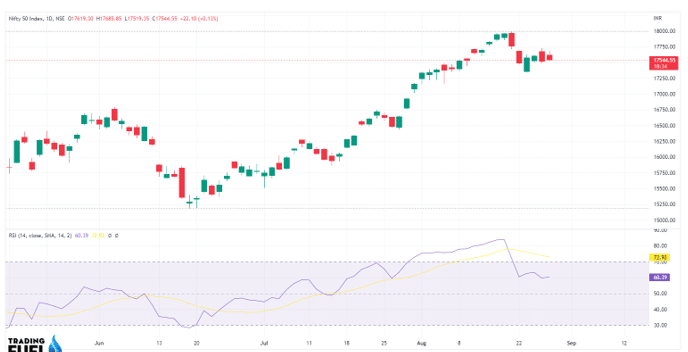
4. Relative Strength Index (RSI):
- This is the indexed form of trading that occurs over a stock over time.
- It will range from 1–100 and will graphically show when a stock is sold or overbought.
- The stock is considered to be overbought when the RSI crosses 70 and is oversold when the RSI reaches below 30.
- The RSI is based on the following formula:
RSI= 100- [100/ (1+ (Average of Upward Price Change/ Average of Downward Price Change))].
The below chart will depict the RSI:
- Once you are done with the technical indicators, you will have to start with the technical analysis.
- For the details of how to do technical analysis, you can refer to the blog that is on our website:
The following are the main steps in technical analysis:

Advanced guide:
- Advanced level intraday traders will go for the transactions in the future and options apart from the transactions in cash.
- The following are the basics of transactions in futures and options:
1. Transactions in Futures:
- A future contract will give you the right to buy or sell a given amount of an underlying asset at a specific price and on or before a specific date.
- Both the parties to a futures contract will have to exercise the contract unless they are deliverable on or before the settlement date.
Features of Futures Trading:

2. Trading in Options:
- An option is a contract between two parties to buy and sell an underlying asset at a pre-specified price on or before a given date.
- There are two types of options:

Features of Option trading:

Conclusion:
We hope that the above blog has given you clarity about what intraday trading is.
FAQs
About Us:
Trading Fuel is our website for blogs where we give you knowledge about finance, economics, the stock market, and intraday trading. Stay tuned with us for more such blogs.