Technical Indicator are the mathematical formulae that trader use on their chart, to understand the past price movement and forecast the future price direction.
Price data includes any combination of the open, high, low or close over a period of your time.
Each indicator has different mathematical formula, some use only the closing prices, while others indicator used volume and open interest into their formulas.
A comparison is often made between present and past levels. In technical indicators are usually shown above or below a price chart.
Why use Indicators?
Indicators are used for three main purposes:
To identify direction, to confirm and to time.
- An indicator can use to confirm the trend direction and momentum of the market. If momentum is waning, it’s going to be a sign to observe for an opportunity of support. Alternatively, if there’s an outsized positive divergence building, it’s going to function an aware of await a resistance breakout.
- Indicators can be used to in conjunction with other technical analysis. If there’s a breakout on the chart, we should look for confirmation form the moving average crossover.
- According to some invest traders, trading is all about timing. Where to buy possible stop loss and target levels.
Leading indicators
• A leading indicator is used to predict the future direction of a market.
• If a leading indicator gives the signal, a trader can enter into trade before the market move and profit from entire trend.
• Leading indicators are by no means 100% accurate, which is why they’re must be combined with other sorts of technical analysis.
Advantages and disadvantage of leading indicators
• They allow for early signals for entry and exit. Early signals can also act to forewarn against the decrease in the momentum of the trend..
• Leading indicators generate more signals and permit more opportunities to trade. Because the leading indications generate more signals, they are best utilized in trading markets only.
• During a market that’s trending up, the simplest use is to assist identify oversold conditions for purchasing opportunities.
• In a down trend, leading indicators can help to spot overbought situations for selling opportunities.
• With early signals comes the prospect of upper returns and with higher returns comes the truth of greater risk.
• More signals and earlier signals mean that the chances of false signals and whipsaw increase.
• False signals will cause to enter into a wrong trade setup which causes you losses. Whipsaws can generate commissions which will eat away profits.
Lagging indicators
• A lagging indicator provides delayed data, which means it gives a signal once the price movement has already completed, and the move is about to end.
• These indicators are widely used by traders as they don’t show any upcoming price moves but confirm the direction of on-going a trend.
• This indicator give traders more confidence , rather than providing a specific trigger for entering the market they give idea about the behaviour of price movement..
Advantages and disadvantage of lagging indicators
- One of the main advantages of lagging indicators is the ability to catch a move and remain in the direction of trend.
- Trend-following indicators are profitable and easy to use.
- The drawback of lagging indicators is that signals can be late. By the time a moving average crossover occurs, a big portion of the move has already occurred.
- Lagging indicators don’t capture the trend accurately. False signals are generated by lagging indicators as it takes same time to trend reversal.
Difference between the leading vs. lagging technical indicators
• The foremost obvious difference is that leading indicators predict market movements, while lagging indicators confirm trends that are already happening
• Leading indicators react to prices quickly, which may be great for short-term traders, but makes them susceptible to giving out false signals.
• Lagging indicators are slower to capture the current trend, lagging indicator might have more accuracy but due to its slow response you can entered at wrong point.
A. Popular leading indicators:
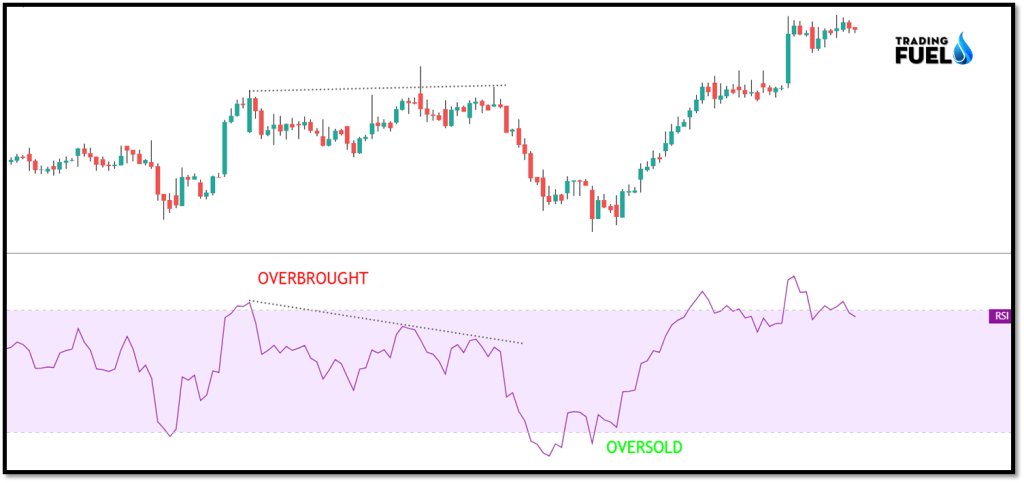
1. Relative strength index (RSI)
The RSI is a momentum indicator, which traders use to identify if the market is in overbought or oversold condition.
When the RSI gives a sign, it’s represent that the market will reverse soon.
RSI oscillate in between the range of 70-30 by default, levels above then 70 is considered over brought and levels below then 30 is considers as oversold.
This provides a number one sign that a trader can enter or exit an on-going trend.
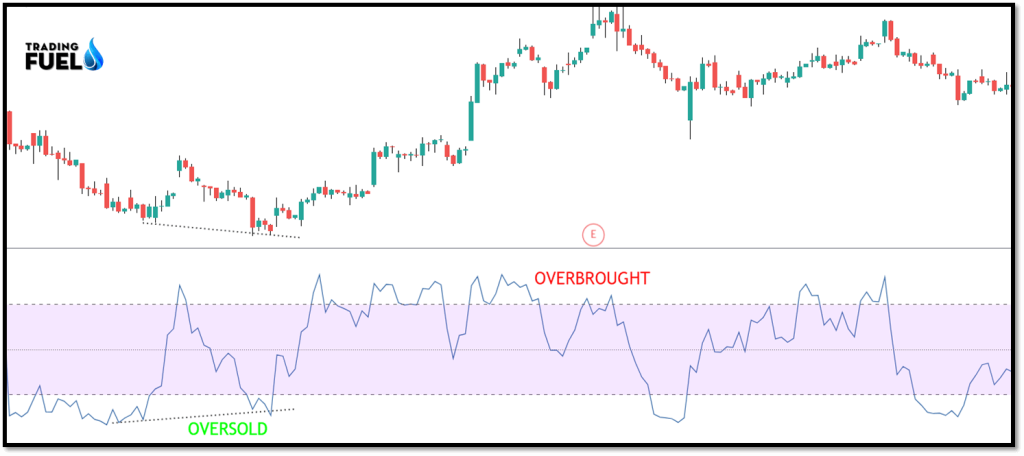
2. Stochastic oscillator:
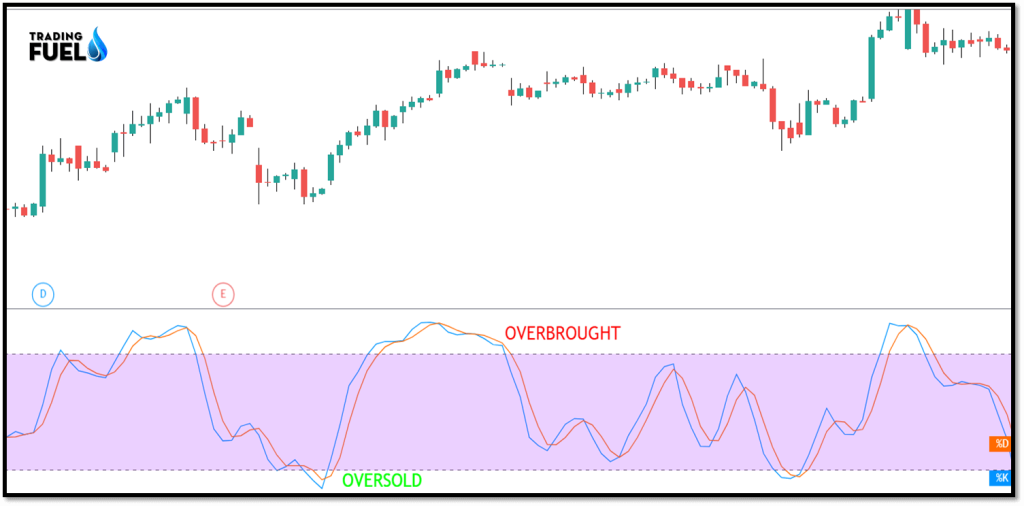
Stochastic oscillator is used to compare recent closing prices to the previous trading range.
The stochastic is predicated on the thought that market momentum changes direction much faster than volume or price, so it are often wont to predict the direction of market movements.
If the oscillator reaches a level of 80 or over, the market would be considered overbought, while below 20, price will be considered to be at oversold zone.
3. Williams % R:
The Williams percentage range, more commonly referred to as the Williams %r, is extremely almost like the stochastic oscillator.
The main difference is that, it works on a negative scale. The scale range from 0 to -100, with 0 to -20 considers over brought and reading -80 to -100 considered oversold.
Reading below -20 indicates that price is trading near the 14 day high low range.
Reading below -80 indicates that price is trading at the low end of its 14 days high low range.
4. On-balance volume (OBV):

On-balance volume (OBV) is another leading momentum-based indicator. It looks at volume to enable traders to form predictions about the market value – OBV is essentially utilized in shares trading, as volume is well documented by exchanges.
Traders who use OBV as a leading indicator will specialise in increases or decreases in volume, without the equivalent change in price. This is believed to be a sign that the worth will increase or decrease imminently.
B. Popular lagging indicators
1. Moving Averages:

A moving average is the average price for a predefined period of trading days, the average price of the prior closing trades are calculated to derive the overall average price for the specifies number of period.
A moving average crossover up is usually used as a buy signal, while a moving average crossover down is employed as a sell/sell short signal.
2. MACD Indicator:

The MACD is an indicator used in technical analysis to give estimate and predict fluctuations of the prices.
• MACD line: it is 12 day exponential moving average minus the market’s 26 day exponential moving average.
• Signal line: it is 9 day exponential moving average of the MACD line.
• MACD histogram: it is the difference between MACD line and the signal line.
The MACD strategies are:
1. Buy and sell on the MACD crossover. This is a trend following strategy.
2. Look for MACD divergences, which *hopefully* help predict turning points in the market.
3. Look for extreme MACD readings in anticipation of a market reversal.
3. Bollinger Bands:

The purpose of those bands is to offer you a relative definition of high and low. In theory, the costs are high at the upper band and low at the lower band.
Bollinger bands include three different lines. The upper, middle, and lower band. The middle band basically is a base for both the upper and lower.
The spacing between the lower, upper, and middle band is decided by volatility. The middle band is of a 20 period moving average.
The upper and lower are two standard deviations below and above the moving average within the middle. Standard deviation may be a statistical measure that gives an excellent reflection of the worth volatility.
Conclusion:
In this blog we have seen how to use indicator, different types of indictor which include lagging and leading indicator. We have covered only the basic of the indicator we will discuss in detail about each and every indicator in next blog. Indicator and oscillator are used to get better understanding of the price movement, every indicator and oscillator is basic of some mathematical formulae which use price and volume for input. Finally i would like to highlight that trading is an art more than science.
Contain & Image ©️ Copyright By, Trading Fuel Research Lab