What Is a Morning Star Candlestick Pattern?
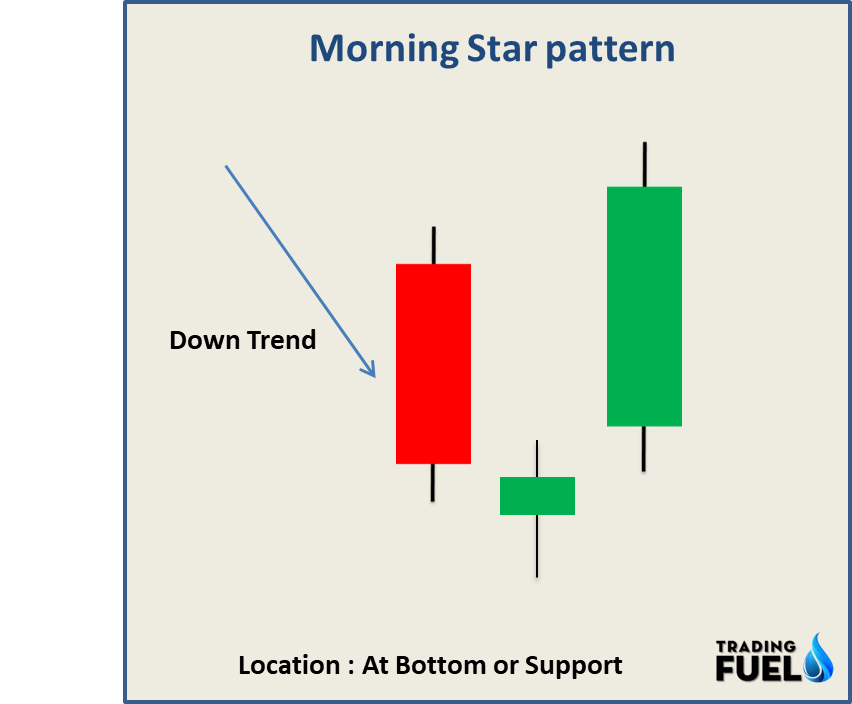
A morning star is one type of candlestick pattern made up of three candles and this pattern is considered a bullish pattern. A morning star forms at the end of a downward trend and it indicates the beginning of an upward trend.
When the Morning Star pattern forms it gives a signal as a reversal of the previous trend. Along with this pattern, traders can confirm of reversal of the trend using different technical indicators.
What Does a Morning Star Tell You?
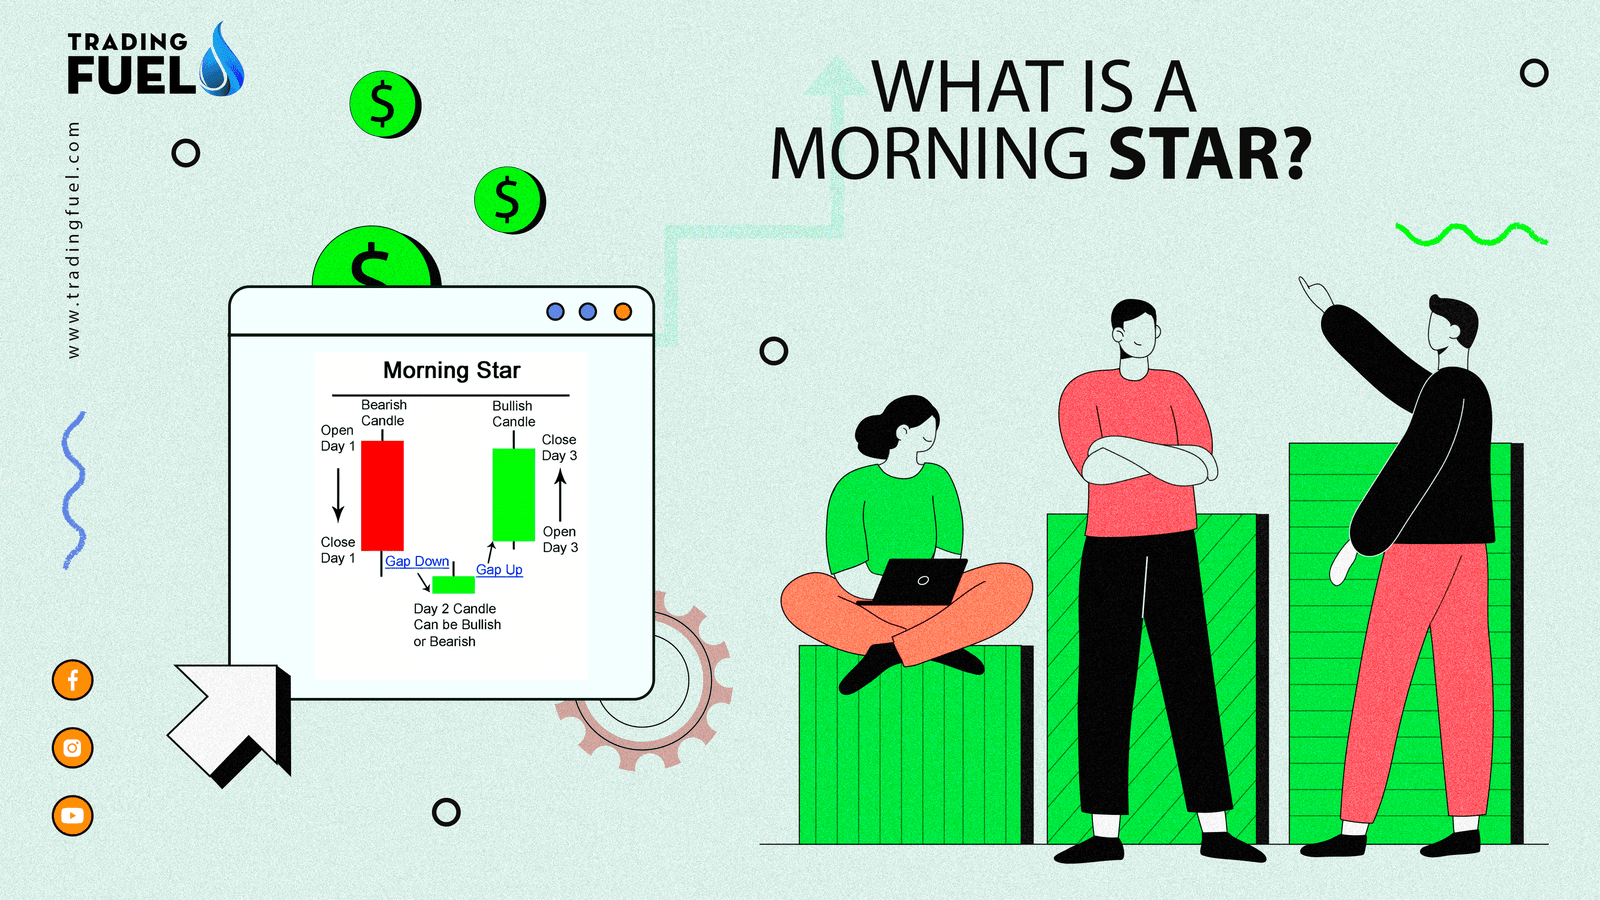
- The morning star is a candlestick pattern made up of three candles. The pattern begins with a big red candlestick, followed by a smaller candlestick that can be either red or green. This second candlestick has a short body and long wicks. Finally, the pattern confirms with a big green candlestick.
- The middle candle of the morning star pattern represents a moment of market indecision, indicating a shift from bearish sentiment to bullish sentiment. This candle signals that the bears are starting to lose control. The third candle in the pattern serves to confirm the reversal and often marks the beginning of a new uptrend.
- In addition, technical indicators can assist in predicting the formation of a morning star pattern. For example, observing if the price action is taking support or determining whether the relative strength index (RSI) indicates that the stock or commodity is oversold can provide valuable insights.
- These indicators can contribute to confirming the potential formation of a morning star pattern and the subsequent bullish reversal.
Here is the image of the Morning Star Pattern
It is important to note that, in the morning star pattern, the middle candle can either be bullish or bearish (red or green).
You Also Like: Top 3 Intraday Trading Strategies
How to Trade a Morning Star?
Morning Star patterns act as visual indicators for the initiation of a trend reversal from bearish to bullish. Another important factor to consider is the volume that goes along with the pattern formation.
Significant volume during the formation of the morning star pattern adds weight to the potential reversal, reinforcing the reliability of the pattern. Therefore, analysing volume in conjunction with the morning star pattern increases its importance in technical analysis.
Mostly, traders prefer to observe increasing volume across all three sessions that form the morning star pattern, with the third day showing the highest volume. We can confirm the pattern with the high volume on the third day’s candle and can make decisions without relying on other indicators.
In response to the formation of the morning star pattern during the third day’s session, a trader may enter a bullish position in the respective stock, commodity, currency pair, or other assets. The trader would then ride the upward trend until there are indications of another reversal in the market.
Trading The Morning Star Candlestick Pattern
In this example, on the Adani daily chart, there was an insistent downward movement in price until it reached a new short-term low. Just before this particular candle, there was a long bearish candle that indicated a strong and sustained downtrend.

In contrast to the sellers’ attempt to push the price to a close near the session’s low, they are unable to maintain control, leading to a rebound in price.
This rebound results in the formation of a doji candle, indicating a state of indecision between buyers and sellers. Subsequently, a long bullish candle emerges, completing the morning star pattern.
With the presence of this pattern, we can anticipate that a bullish reversal is likely to occur, providing a strong indication of a shift in market sentiment.
You Also Read: Top 10 Candlestick Pattern
Limitations of Using the Morning Star Pattern
Trading only based on visual patterns can indeed have risks. It is important to have supporting factors such as volume and additional indicators like support levels when identifying a morning star pattern. Relying only on the visual aspect of a small candle appearing in a downtrend can lead to numerous false signals and misinterpretations of morning star formations.
By including volume and other indicators, traders can enhance the reliability and validity of the morning star pattern, reducing the potential for false signals and making more informed trading decisions.
Morning Star Candlestick Pattern (Amibroker AFL)
// Downloaded From https://www.TradingFuel.com
/* Morning & Evening Star Buy and sell)
by By D Nayab August 2021*/
MHT=  HHV(H,5)==H;
MHY=   HHV(H,5)==Ref ( H, -1);
MLT=   LLV(L,5)==L;
MLY=   LLV(L,5)==Ref(L,-1);
LargeBodyMinimum=0.01;//greater than 1.0%
smallBodyMaximum=0.0025;//less than 0.25%
whiteBody=C>=O;
blackBody=O>C;
O1 = Ref(O,-1);O2 = Ref(O,-2);
H1 = Ref(H,-1);H2 = Ref(H,-2);
L1 = Ref(L,-1);L2 = Ref(L,-2);
C1 = Ref(C,-1);C2 = Ref(C,-2);
largeBody=(C>=O*(1+largeBodyMinimum) AND whiteBody) OR C<=O*(1-largeBodyMinimum) AND blackBody;
smallBody=(O>=C*(1-smallBodyMaximum) AND whiteBody) OR (C>=O*(1-smallBodyMaximum) AND blackBody);
upGap=  IIf(Ref(blackBody,-1)AND whiteBody AND O>Ref(O,-1),1,
        IIf(Ref(blackbody,-1) AND blackBody AND C>Ref(O,-1),1,
        IIf(Ref(whiteBody,-1) AND whiteBody AND O>Ref(C,-1),1,
        IIf(Ref(whiteBody,-1) AND blackBody AND C>Ref(C,-1),1,0))));

Buy=Ref(Close,-2)<=Ref(Open,-2)*.99 AND Ref(Open,-1)<=Ref(Close,-2) AND Ref(Close,-1)<=Ref(Close,-2) AND Close>Ref(Close,-2) AND Close>=Open*1.01 AND Volume > Ref( MA( Volume, 15 ), -50 );
Sell=Ref(LargeBody,-2) AND Ref(whiteBody,-2) AND Ref(upGap,-1) AND NOT Ref(largeBody,-1) AND blackBody AND NOT smallBody AND (MHT OR MHY);
In conclusion,
The morning star candle stick pattern is a bullish reversal signal that consists of three candles. The pattern indicates a shift from a downtrend to an uptrend. Traders should consider the volume and other indicators to validate the pattern and reduce false signals. While visual patterns alone can be risky, incorporating supporting factors improves the reliability of the morning star pattern for informed trading decisions.
Contain & Image ©️ Copyright By, Trading Fuel || Research Lab