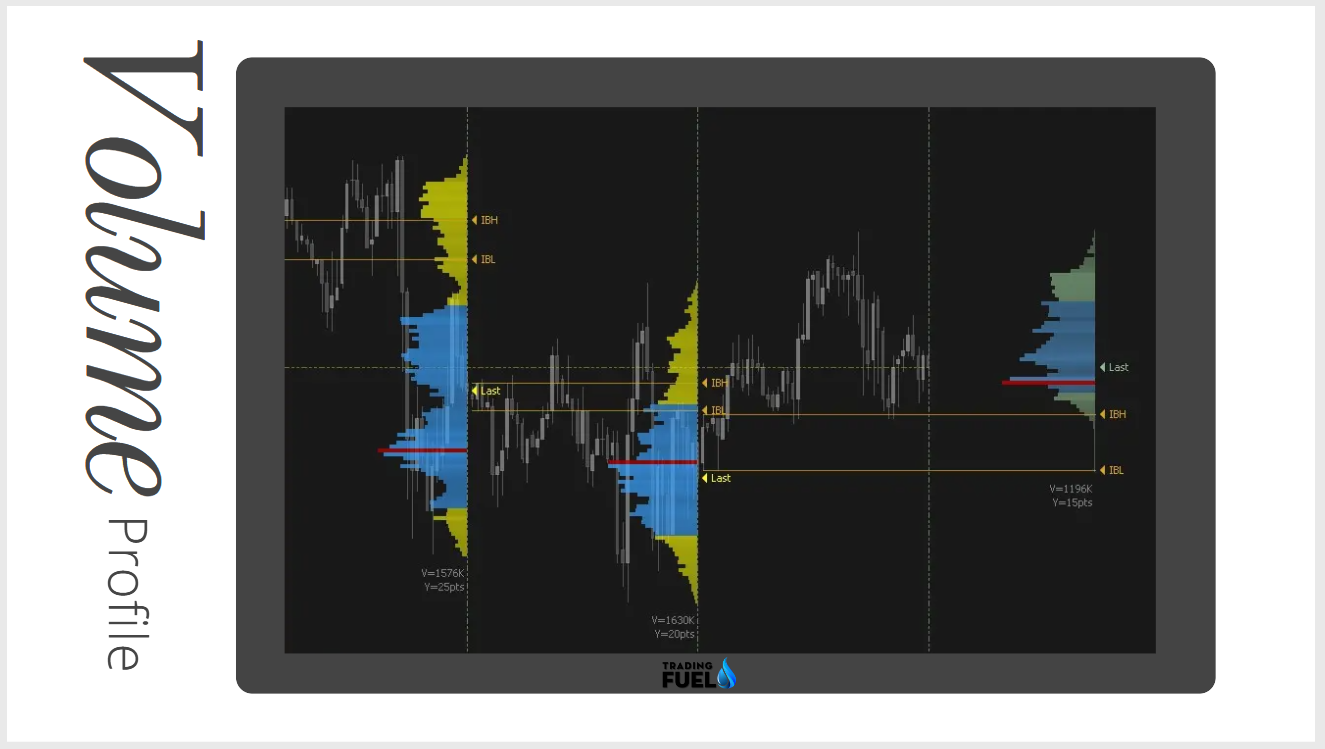
The Volume Profile Indicator is a technical analysis tool that displays the distribution of trading volume over a certain period of time. It can be used to identify key levels of support and resistance, as well as to gauge the strength of a current trend.
The Volume Profile Indicator is typically presented as a histogram, with the horizontal axis representing the price range and the vertical axis representing the volume. The histogram is divided into “volume profile” which shows the distribution of volume at different price levels.
One of the key benefits of using the Volume Profile Indicator is that it can help traders identify key levels of support and resistance. This is because heavy trading volume at a certain price level can act as a barrier to further price movement in that direction. For example, if there is a heavy volume at a certain price level, it may be difficult for the price to break through that level, indicating a potential resistance level.
Another benefit of the Volume Profile Indicator is that it can help traders gauge the strength of a current trend. For example, if the volume profile is heavily skewed in favour of buying volume, it may indicate a strong bullish trend. Conversely, if the volume profile is heavily skewed in favour of selling volume, it may indicate a strong bearish trend.
It’s also important to note that the Volume Profile Indicator can be used in conjunction with other technical analysis tools, such as moving averages and trend lines, to provide a more comprehensive view of market conditions.
Components of Volume Profile

1. Open, High, Low and Close
The OHLC, or open, high, low, and close, are commonly used in volume profile indicators. Different styles of indicators may use different methods, but the OHLC is a standard among most of them.
2. Point of Control (POC)
The Point of Control (POC) is a price level where the majority of trading volume occurred during a session. It is often used as a key metric in volume profile analysis and is a commonly referenced point in trading.
3. Value Area
The Value Area (VA) is a price range within which a specified percentage of trading volume occurred during a session. Many volume profile traditionalists use 70% as the percentage, as it is close to one standard deviation from the mean. The Point of Control (POC) is often used as the mean in a volume profile when calculating the Value Area.
4. High Volume Node
The High-Volume Node (HVN) is a price level where there is an unusual concentration of volume compared to the surrounding price action. It can be used as an important level of support or resistance, and traders often pay close attention to these areas when analysing volume profile.
5. Low volume node
The Low Volume Node (LVN) is a price level where there is a relatively low concentration of volume compared to the surrounding price action. These areas of low volume are considered to be less significant than areas of high volume and are less likely to affect the price action. Traders will often pay less attention to these areas when analyzing volume profiles.
Must Know: Top 10 Intraday Trading Techniques
Volume Profile Indicator Strategy
A strategy that incorporates the use of the Volume Profile Indicator can involve several steps:
Identify the key levels of support and resistance using the Volume Profile Indicator. These levels are typically the price levels where the heaviest trading volume has occurred.
- Look for a pattern of higher volume at key levels. This pattern is known as “volume point of control (VPOC)” and is a key level of interest for traders.
- Identify the trend of the market using other indicators such as moving averages and trend lines. The trend should be in the direction of the identified VPOC.
- When the price reaches the VPOC, enter a trade in the direction of the trend, with a stop loss order placed just outside of the VPOC.
- If the price moves in favour of the trade, move the stop loss order to break even, and then trail it to lock in profits as the price moves in your favour.
- Exit the trade when the price reaches the next key level of resistance or support, or when the trend changes.

It’s important to note that this strategy can be adjusted according to individual preferences and market conditions. As with any trading strategy, it’s important to backtest and forward-test it before using it in live trading. Additionally, the Volume Profile Indicator should be used in conjunction with other technical analysis tools and indicators to provide a more comprehensive view of market conditions.
You also like: Top 3 Intraday Trading Strategies
One strategy that incorporates a volume profile indicator is the “value area” strategy.
- The value area strategy involves identifying the range of prices where the majority of the volume has been traded, known as the “value area”. This range is considered a key level of support and resistance and traders will watch for the price to either break through or bounce off this level.
- To implement the value area strategy:
- Identify the value area by looking at the volume profile indicator.
- Watch for the price to either break through or bounce off the value area.
- If the price breaks through the value area, it can be used as a potential level of support or resistance, depending on the direction of the break.
- If the price bounces off the value area, traders may look to enter a trade in the direction of the bounce.

- Traders may also use other technical indicators, such as moving averages and relative strength index (RSI), to confirm their trade signals.
It’s important to note that the value area strategy is just one way to use a volume profile indicator and it should be used in conjunction with other technical analysis and risk management techniques.
Volume Profile Indicator AFL (Amibroker AFL)
// Downloaded From https://www.TradingFuel.com
_SECTION_BEGIN("Price");
SetChartOptions(0,chartShowArrows|chartShowDates);
_N(Title = StrFormat("{{NAME}} - {{INTERVAL}} {{DATE}} Open %g, Hi %g, Lo %g, Close %g (%.1f%%) {{VALUES}}", O, H, L, C, SelectedValue( ROC( C, 1 ) ) ));
Plot( C, "Close", ParamColor("Color", colorDefault ), styleNoTitle | ParamStyle("Style") | GetPriceStyle() );
_SECTION_END();

_SECTION_BEGIN("Universal VSA 2");
// Volume Calculations //
av=MA(V,30); //avg vol
uhv=IIf(V>2*av,1,Null); //very high vol
hV=IIf(V>1.1*av AND V<2*av,1,Null); //high volume
Lv=IIf(V>0.5*aV AND V<0.9*av,1,Null); //low volume
ulv=IIf(V<0.5*av,1,Null); //ultra low vol

// Range Calculations //
r=H-L; //daily range
Hb=(H+L)/2; //Half Back
ar=EMA(r,30); //avg range
uwrb=IIf(r>2*ar,1,Null); // ultra wide range bar
wrb=IIf(r>1.33*ar AND r<2*ar,1,Null); //wide range bar
nrb=IIf(r>0.67*ar AND r<1.33*ar,1,Null); //nrmal range bar
srb=IIf(r<0.67*ar,1,Null); //small range bar
usrb=IIf(r<0.5*ar,1,Null); // ultra small range bar
PlotOHLC(Null,H,L,C,"Price",IIf(C>Ref(C,-1),colorBlue,IIf(C==Ref(C,-1),colorBlack,colorRed)),styleBar+styleThick);

// Diamond Trending System
wm=WMA(C,40);
Plot(wm,"WMA",IIf(wm>Ref(wm,-1),colorSkyblue,colorLightOrange),styleDots+styleThick+styleNoLine);

// Close Position //
u3=IIf(C>(H-r/3),1,Null); // Upper 3rd
m3=IIf(C<(H-r/3) AND C>(L+r/3),1,Null); // Middle 3rd
L3=IIf(C<(L+r/3),1,Null); // Lower 3rd

// Trend //
h5d=IIf(H>Ref(HHV(H,5),-1),1,Null); // 5 day high
h20d=IIf(H>Ref(HHV(H,20),-1),1,Null); // 20 day high
h50d=IIf(H>Ref(HHV(H,50),-1),1,Null); // 50 day high
h100d=IIf(H>Ref(HHV(H,100),-1),1,Null); // 100 day high
l5d=IIf(L<Ref(LLV(L,5),-1),1,Null); // 5 day low
l20d=IIf(L<Ref(LLV(L,20),-1),1,Null); // 20 day low
l50d=IIf(L<Ref(LLV(L,50),-1),1,Null); // 50 day low
l100d=IIf(L<Ref(LLV(L,100),-1),1,Null); // 100 day low

//SOS//
//Stopping Volume
sos1=C<Ref(C,-1) AND ((V>Ref(HHV(V,3),-1) AND l20d) OR uhv) AND (uwrb OR wrb) AND (m3 OR u3);
//Selling Climax
sos2=C<Ref(C,-1) AND ((hv AND l20d) OR uhv) AND (uwrb OR wrb) AND (m3 OR u3) ;
//Demand Overcoming Supply
sos3=C<Ref(C,-1) AND (m3 OR u3) AND (nrb OR srb) AND (l20d OR uhv);
//Bag Holding
sos4=C<Ref(C,-1) AND uhv AND H<Ref(L,-1) AND (nrb OR srb OR usrb) AND l100d;
//Shake Out
sos5=(uwrb OR wrb OR r>ar) AND u3 AND l5d;
//No Supply
sos6=C<Ref(C,-1) AND ((r<Ref(r,-1)AND r<Ref(r,-2)) OR srb OR usrb) AND (V<Ref(V,-1) AND V<Ref(V,-2));
//Professional Buying
sos7=C<Ref(C,-1) AND L3 AND (uhv OR ((Hv OR V>Ref(HHV(V,5),-1)) AND L5d)) AND Ref(C,1)>C;
//Trap Dn Move
sos8=L<Ref(L,-1) AND C>Ref(H,-1) AND (hv OR uhv OR V>Ref(HHV(V,5),-1));

//SOS Plotting//
//Stopping Volume
PlotShapes(IIf(sos1,shapeSmallUpTriangle,Null),IIf(Ref(C,1)>C,colorGreen,colorPaleGreen),0,Low);
//Selling Climax
PlotShapes(IIf(sos2,shapeSmallUpTriangle,Null),IIf(Ref(C,1)>C,colorGreen,colorPaleGreen),0,Low);
//Demand Overcoming Supply
PlotShapes(IIf(sos3,shapeSmallUpTriangle,Null),IIf(Ref(C,1)>C,colorGreen,colorPaleGreen),0,Low);
//Bag Holding
PlotShapes(IIf(sos4,shapeSmallUpTriangle,Null),IIf(Ref(C,1)>C,colorGreen,colorPaleGreen),0,Low);
//Shake Out
PlotShapes(IIf(sos5,shapeUpArrow,Null),IIf(Ref(C,1)>C,colorGreen,colorPaleGreen),0,Low);
//No Supply
PlotShapes(IIf(sos6,shapeSmallCircle,Null),IIf(Ref(C,1)>C,colorGreen,colorPaleGreen),0,Low);
//Professional Buying
PlotShapes(IIf(sos7,shapeUpArrow,Null),IIf(Ref(C,1)>C,colorGreen,colorPaleGreen),0,Low);
//Trap Dn Move
PlotShapes(IIf(sos8,shapeSmallUpTriangle,Null),IIf(Ref(C,1)>C,colorGreen,colorPaleGreen),0,Low);

//SOW//
//Supply Coming In
sow1=C>Ref(C,-1) AND ((V>Ref(HHV(V,3),-1) AND h20d) OR uhv) AND (uwrb OR wrb) AND (m3 OR l3);
//Buying Climax
sow2=C>Ref(C,-1) AND ((hv AND h20d) OR uhv) AND (uwrb OR wrb) AND (l3 OR m3);
//Supply Overcoming Demand
sow3=C>Ref(C,-1) AND (m3 OR l3) AND (nrb OR srb) AND (h20d OR uhv);
//End Of Rising Market
sow4=C>Ref(C,-1) AND uhv AND (nrb OR srb OR usrb) AND h100d;
//Upthrust
sow5=(uwrb OR wrb OR r>ar) AND l3 AND h5d;
//No Demand
sow6=C>Ref(C,-1) AND ((r<Ref(r,-1)AND r<Ref(r,-2)) OR srb OR usrb) AND (V<Ref(V,-1) AND V<Ref(V,-2));
//Professional Selling
sow7=C>Ref(C,-1) AND u3 AND (uhv OR ((hv OR V>Ref(HHV(V,5),-1)) AND H5d)) AND Ref(C,1)<C;
//Trap Up Move
sow8=H>Ref(H,-1) AND C<Ref(L,-1) AND (hv OR uhv OR V>Ref(HHV(V,5),-1));

//SOW Plotting//
//Supply Coming In
PlotShapes(IIf(sow1,shapeSmallDownTriangle,Null),IIf(Ref(C,1)<C,colorRed,colorPink),0,High);
//Buying Climax
PlotShapes(IIf(sow2,shapeSmallDownTriangle,Null),IIf(Ref(C,1)<C,colorRed,colorPink),0,High);
//Supply Overcoming Demand
PlotShapes(IIf(sow3,shapeSmallDownTriangle,Null),IIf(Ref(C,1)<C,colorRed,colorPink),0,High);
//End Of Rising Market
PlotShapes(IIf(sow4,shapeSmallDownTriangle,Null),IIf(Ref(C,1)<C,colorRed,colorPink),0,High);
//Upthrust
PlotShapes(IIf(sow5,shapeDownArrow,Null),IIf(Ref(C,1)<C,colorRed,colorPink),0,High);
//No Demand
PlotShapes(IIf(sow6,shapeSmallCircle,Null),IIf(Ref(C,1)<C,colorRed,colorPink),0,High,12);
//Professional Selling
//PlotShapes(IIf(sow7,shapeDownArrow,Null),IIf(Ref(C,1)<C,colorRed,colorPink),0,High);
//Trap Up Move
PlotShapes(IIf(sow8,shapeSmallDownTriangle,Null),IIf(Ref(C,1)<C,colorRed,colorPink),0,High);

//TITLE
if( Status("action") == actionIndicator )
(
Title = StrFormat("{{NAME}} - {{INTERVAL}} {{DATE}} High %g, Low %g, Close %g ", H, L, C )+ "\n"+
//Title = Name()+"  "+Interval()+" "+Date()+"  "+"High "+High+"  "+"Low "+Low+"  "+"Close "+Close +
EncodeColor(colorGreen)+
WriteIf (sos1, "Stopping Volume  "+"\n","")+
WriteIf (sos2, "Selling Climax  "+"\n","")+
WriteIf (sos3, "Demand Overcoming Supply  "+"\n","")+
WriteIf (sos4, "Bag Holding  "+"\n","")+
WriteIf (sos5, "Shakeout  "+"\n","")+
WriteIf (sos6, "No Supply  "+"\n","")+
WriteIf (sos7, "Professional Buying  "+"\n","")+
WriteIf (sos8, "Trap Down Move  "+"\n","")+
EncodeColor(colorRed)+
WriteIf (sow1, "Supply Coming In  "+"\n","")+
WriteIf (sow2, "Buying Climax  "+"\n","")+
WriteIf (sow3, "Supply Overcoming Demand  "+"\n","")+
WriteIf (sow4, "End OF Rising Market  "+"\n","")+
WriteIf (sow5, "Upthrust  "+"\n","")+
WriteIf (sow6, "No Demand  "+"\n","")+
WriteIf (sow7, "Professional Selling  "+"\n","")+
WriteIf (sow8, "Trap Up Move  "+"\n","")
);

//Commentary
if( Status("action") == actionCommentary )
(
printf ( "VOLUME PRICE ANALYSIS" +"\n"+"\n"));

WriteIf (sos1, "Stopping Volume

BG: Downtrend.

FF: Shakeouts AND Tests AND Test Of Demand area On Low Volume AND narrow spreads.

UNF: High Volume up bars closing off the highs, Upthrusts, No Demand" +"\n"+"\n","")+
WriteIf (sos2, "Selling Climax

BG: Downtrend.

FF: Shakeouts AND Tests AND Test Of DEMAnd area On Low Volume AND narrow spreads.

UNF: High Volume up bars closing off the highs, Upthrusts, No Demand" +"\n"+"\n","")+
WriteIf (sos3, "Demand Overcoming Supply

BG: Downtrend.

FF: Volume is High expect shakeouts. Tests AND Test Of Demand area On Low Volume AND narrow spreads. Volume is Low expect Higher prices, failure to rise indicate MArket NOT ready to go up yet.

UNF: High Volume up bars closing off the highs, Upthrusts, No Demand" +"\n"+"\n","")+
WriteIf (sos4, "Bag Holding

BG: Downtrend.

FF: Prices should rise immediately. Shakeouts AND Tests AND Test Of Demand area On Low Volume AND narrow spreads.

UNF: High Volume up bars closing off the highs, Upthrusts, No Demand" +"\n"+"\n","")+
WriteIf (sos5, "Shakeout

BG: SOS, Selling Climax, Stopping Volume.

FF: Tests AND Test Of Demand area On Low Volume AND narrow spreads. Markets starts to move sideways AND whipsaws it may be building cause for next up move.

UNF: High Volume up bars closing off the highs, Upthrusts, No Demand" +"\n"+"\n","")+
WriteIf (sos6, "No Supply

BG: SOS. Minor sign Of weakness in an uptrend. Weakness in the BG reduces its effectiveness.

FF: Next bar should be up. Small shakeout is Very bullish. The shakeout Can also be On two bars.

UNF: High Volume wide spread down bar."+"\n"+"\n","")+
WriteIf (sos7, "Professional Buying

BG: Downtrend.

FF: Shakeouts AND Tests AND Test Of DEMAnd area On Low Volume AND narrow spreads.

UNF: High Volume up bars closing off the highs, Upthrusts, No Demand" +"\n"+"\n","")+
WriteIf (sos8, "Trap Down Move

BG: Downtrend.

FF: Prices should rise immediately.

UNF: High Volume up bars closing off the highs, Upthrusts, No Demand" +"\n"+"\n","")+
////////////////////////////////////////////////////////////////////////////////////
WriteIf (sow1, "Supply Coming In

BG: After rising prices possible start Of distribution. Old top in BG possible absorption Volume.

FF: Upthrusts, no demand bars, High Volume up bars closing off the highs OR on narrow spreads.

UNF: High vol down bars closing off the lows, may need further testing. Prices move abv this area of supply, may come back to test it later, a Low Volume test would be bullish."+"\n"+"\n","")+
WriteIf (sow2, "Buying Climax

BG: Uptrend.

FF: Upthrusts, no demand bars, High Volume up bars closing off the highs OR on narrow spreads.

UNF: Low Volume down bars OR High Volume down bars closing off the lows suggest, market is NOT ready to fall. High Volume up bars pushing through the old highs represent absorption Volume."+"\n"+"\n","")+
WriteIf (sow3, "Supply Overcoming Demand

BG: After rising market it is a start Of distribution. There is an Old top in BG then possible Absorption Volume.

FF: Upthrusts, no demand bars, High Volume up bars closing off the highs OR on narrow spreads.

UNF: High vol down bars closing off the lows, may need further testing. "+"\n"+"\n","")+
WriteIf (sow4, "End Of Rising Market

BG: Substantial up move.

FF: Test of this bar on narrow spreads AND Low Volume is further SOW.

UNF: No Supply bars OR dn bars on High Volume closing off the lows show sign of strength, needs testing. The weakness will NOT suddenly disappear. "+"\n"+"\n","")+
WriteIf (sow5, "Upthrust

BG: Weakness in BG is a must, can be High Volume up bars closing in the middle OR no demand bars. There is strength in the background this may be tested OR may be False upthrusts.

FF: Expect lower prices. No demand adds to weakness. if we get a test dn AND we have weakness in the BG this may well fail.

UNF: No supply bar suggest lack of selling pressure. Dn bars on High Volume closing off the lows show sign of strength, needs testing. "+"\n"+"\n","")+
WriteIf (sow6, "No Demand

BG: Weakness in the background OR minor SOS in a down trend. Strength in BG weakens its effect.

FF: Next bar should be down. Small upthrust is Very bullish. The upthrust Can also be On two bars.

UNF: High Volume wide spread up bar."+"\n"+"\n","")+
WriteIf (sow7, "Professional Selling

BG: Uptrend.

FF: Upthrusts, no demand bars, High Volume up bars closing off the highs OR on narrow spreads.

UNF: Low Volume down bars OR High Volume down bars closing off the lows suggest, market is NOT ready to fall. No supply suggest lack of selling pressure."+"\n"+"\n","")+
WriteIf (sow8, "Trap Up Move

BG: Uptrend.

FF: Prices should fall immediately.

UNF: High Volume down bars closing off the lows, Shakeouts, No Supply" +"\n"+"\n","")
;

// Buy Sell Overlay //
mystartbar = SelectedValue(BarIndex());

mystartbartime = LastValue(ValueWhen(mystartbar == BarIndex(), TimeNum(),1));
InitialValue = ValueWhen(mystartbar == BarIndex(), H , 1 ) ;
InitialValue1 = ValueWhen(mystartbar == BarIndex(), L , 1 ) ;
InitialValue2 = ValueWhen(mystartbar == BarIndex(), TimeFrameGetPrice("H",inDaily,0) , 1 ) ;
InitialValue3 = ValueWhen(mystartbar == BarIndex(), TimeFrameGetPrice("L",inDaily,0) , 1 ) ;
InitialValue4 = ValueWhen(mystartbar == BarIndex(), (TimeFrameGetPrice("H",inDaily,0)+TimeFrameGetPrice("L",inDaily,0))*0.5 , 1 ) ;
InitialValue5 = ValueWhen(mystartbar == BarIndex(), L-20 , 1 ) ;
InitialValue6 = ValueWhen(mystartbar == BarIndex(), H - 10 , 1 ) ;
InitialValue7 = ValueWhen(mystartbar == BarIndex(), L + 10 , 1 ) ;
Temp = IIf(BarIndex() >= mystartbar, InitialValue, Null) ;
Temp1 = IIf(BarIndex() >= mystartbar, InitialValue1, Null) ;
Temp2 = IIf(BarIndex() >= mystartbar, InitialValue2, Null) ;
Temp3 = IIf(BarIndex() >= mystartbar, InitialValue3, Null) ;
Temp4 = IIf(BarIndex() >= mystartbar, InitialValue4, Null) ;
Temp5 = IIf(BarIndex() >= mystartbar, InitialValue5, Null) ;
Temp6 = IIf(BarIndex() >= mystartbar, InitialValue6, Null) ;
Temp7 = IIf(BarIndex() >= mystartbar, InitialValue7, Null) ;
Plot(Temp, "H", colorGreen,styleThick);
Plot(Temp1, "L", colorRed,styleThick);
/*Plot(Temp2, "", colorBrown,styleDashed);
Plot(Temp3, "", colorBrown,styleDashed);
Plot(Temp4, "", colorBrown,styleDashed);
Plot(Temp5, "", colorBrown,styleDashed);
Plot(Temp6, "", colorBlue,styleDashed);
Plot(Temp7, "", colorBlue,styleDashed);*/
_SECTION_END();

_SECTION_BEGIN("VAP");
segments = IIf( Interval() < inDaily, Day(), Month() );
segments = segments != Ref( segments , -1 );

PlotVAPOverlayA( segments , Param("Lines", 300, 100, 1000, 1 ), Param("Width", 80, 1, 100, 1 ), ParamColor("Color", colorGold ), ParamToggle("Side", "Left|Right" ) | 2 * ParamToggle("Style", "Fill|Lines", 0) | 4*ParamToggle("Z-order", "On top|Behind", 1 ) );
Plot(segments, "", colorLightGrey, styleHistogram | styleOwnScale );
_SECTION_END();

_SECTION_BEGIN("VWAP");
/*
The VWAP for a stock is calculated by adding the dollars traded for every
transaction in that stock ("price" x "number of
      shares traded") and dividing the total shares traded. A VWAP is computed
from the Open of the market to the market Close, AND is
      calculated by Volume weighting all transactions during this time period
*/

Bars_so_far_today = 1 + BarsSince( Day() != Ref(Day(), -1));
bars_this_month = 1 + BarsSince( Month() != Ref(Month(), -1));
StartBar = ValueWhen(TimeNum() == 093000, BarIndex());
TodayVolume = Sum(V,Bars_so_far_today);
MonthVolume = Sum(V,bars_this_month);
VWAP_M = Sum (C * V, bars_this_month  ) / MonthVolume;

IIf (BarIndex() >= StartBar, VWAP = Sum (C * V, Bars_so_far_today  ) / TodayVolume,0);
Plot (VWAP,"VWAP",colorBrown, styleThick,Null,Null,Null,1);
//Plot (VWAP_M,"VWAP_M",colorGreen, styleLine,Null,Null,Null,1);

_SECTION_END();

_SECTION_BEGIN("Close Daily");
Plot(TimeFrameGetPrice("O",inDaily),"",colorGreen,styleThick,Null,Null,0,1);
Plot((TimeFrameGetPrice("H",inDaily)+TimeFrameGetPrice("L",inDaily))*0.5,"",colorGold,styleThick,Null,Null,0,1);
Plot(TimeFrameGetPrice("C",inDaily),"",colorRed,styleThick,Null,Null,0,1);
//Plot(Ref(LastValue(TimeFrameGetPrice("C",inDaily)),-50),"",colorIndigo,styleThick,Null,Null,50,1);
//Plot(Ref(LastValue(TimeFrameGetPrice("L",inDaily)),-50),"",colorIndigo,styleThick,Null,Null,50,1);
Plot(Ref(LastValue(TimeFrameGetPrice("C",inDaily)),-50),"",colorRed,styleThick+styleDashed,Null,Null,50,1);
//PlotShapes(IIf(Day()!=Ref(Day(),-1),shapeSmallSquare,Null),colorGreen,0,TimeFrameGetPrice("O",inDaily),0);
//PlotShapes(IIf(Day()!=Ref(Day(),-1),shapeSmallSquare,Null),colorRed,0,TimeFrameGetPrice("C",inDaily),0);
_SECTION_END();

_SECTION_BEGIN("Watermark");
GfxSetOverlayMode(1);
GfxSelectFont("Tahoma", Status("pxheight")/20 );
GfxSetTextAlign( 6 );// center alignment
GfxSetTextColor( ColorRGB( 200, 200, 200 ) );
GfxSetBkMode(1); // transparent
GfxTextOut( "#VolumeProfile", Status("pxwidth")/1.25, Status("pxheight")/16);
GfxTextOut( "tradingfuel.com", Status("pxwidth")/1.25, Status("pxheight")/8);
_SECTION_END();
In conclusion,
the Volume Profile Indicator is a useful tool for identifying key levels of support and resistance, as well as gauging the strength of a current trend. It can be used in conjunction with other technical analysis tools to provide a more comprehensive view of market conditions.
Contain & Image ©️ Copyright By, Trading Fuel || Research Lab