
Technical Analysis of Stock
Technical analysis involves analysing the price movement of a company’s stock (or any tradable financial instrument) by using charts and statistical indicators.
Its purpose is to identify levels of price support and resistance, as well as determine the stock’s range and trends.
Examining historical price patterns and behaviours helps to predict the possible future direction of the stock. It is important to note that this approach only concentrates on the stock’s price and does not consider the company’s operations.
How Does Technical Analysis Work?
Technical analysis utilizes historical price data to analyse the supply and demand zone that influences changes in share prices. In this context, institutions, mutual funds, and hedge funds are likened to dinosaurs, as they play a significant role in moving stock prices.
By visually observing the activities of these “dinosaurs” through charts and indicators, the technical analysis identifies key price levels that attract significant buying or selling interest. This approach recognizes the tendency of history to repeat itself, as evidenced by recurring price patterns.
Who is Technical Analysis For?
- It is advisable for anyone involved in trading or investing in the stock market or other tradable financial instruments to acquire a fundamental understanding of technical analysis.
- When your funds are invested in assets that experience price fluctuations, applying technical analysis can assist you in making more informed choices regarding the appropriate level of risk to assume about the potential reward.
- By applying technical analysis, you can improve your decision-making process and ability to manage your investments effectively.
- Stocks are a representation of a company’s business and operations. Nevertheless, the stock price reflects not only the current perception of the company but also its future valuation and performance.
- It is common for a disparity to exist between the actual business operations and the stock price. Technical analysis plays a crucial role in identifying and understanding this discrepancy, as well as assessing the potential opportunities it presents.
- By utilizing technical analysis, investors can get insights into the gaps between the company’s fundamental value and its stock price, enabling them to identify potential investment opportunities.
Basics of Technical Analysis
The Technical analysis encompasses the use of diverse tools and indicators. By employing an appropriate combination of these tools, one can generate converging signals that enhance the likelihood of accurately predicting the direction of price movements.
By utilizing a comprehensive set of indicators, traders and investors can improve their ability to make informed decisions regarding the future movement of prices.
Stock Charts
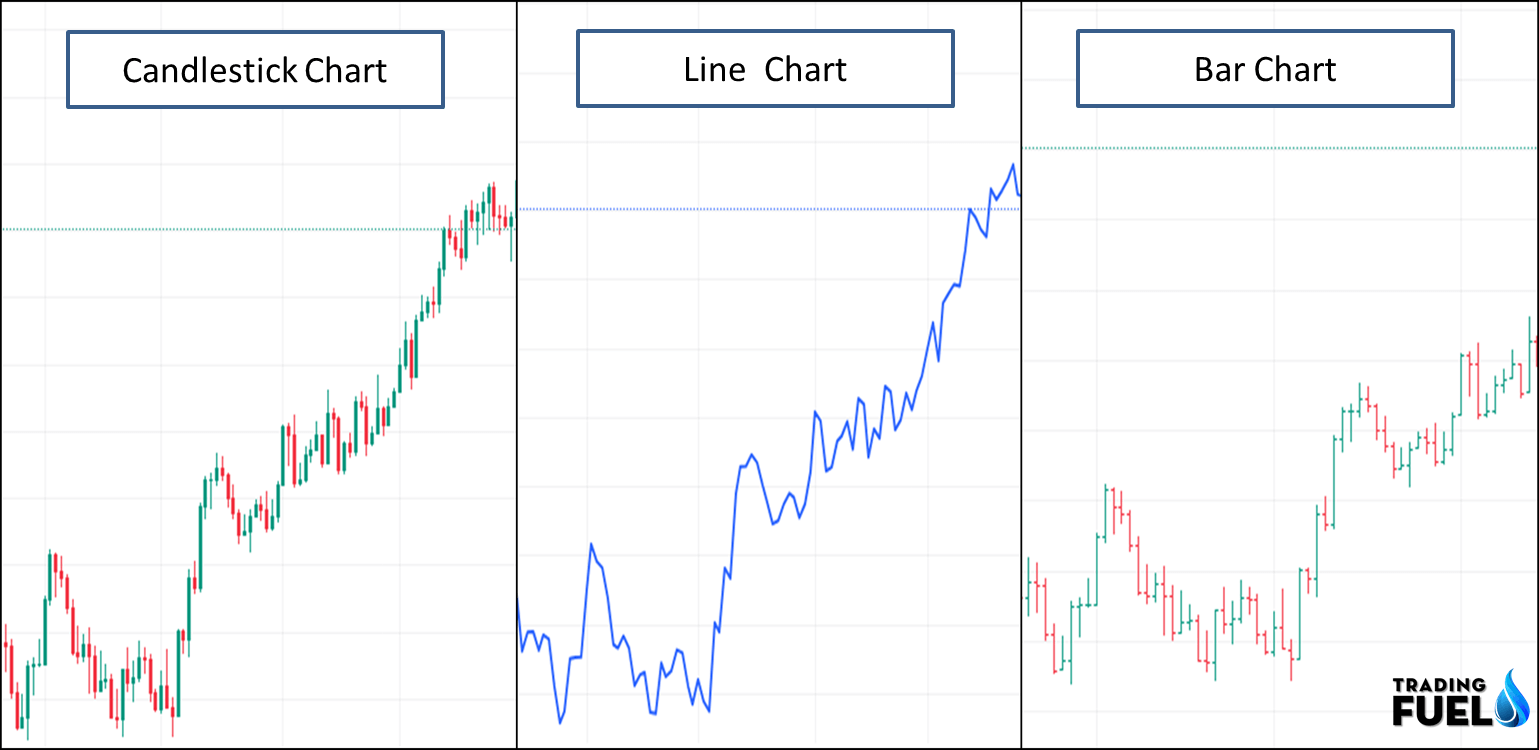
The most commonly used types of charts are the candlestick, bar, and line charts. These charts depict the prices at which trades have been executed.
The time interval for the chart can be adjusted to specific settings, which divide the price action into segments. For instance, a 5-minute candlestick chart represents each candle as a five-minute trading segment, recording the open, high, low, and close prices during that period.
At the end of each five-minute window, a candlestick is displayed, comprising the four data points (open, high, low, close), along with a fifth data point represented by the body.
The body of the candlestick is coloured red if the closing price is lower than the opening price, and green if the closing price is higher. Bar charts provide the same information without illustrating the body, while line charts simply connect the closing prices for each time.
Support/Resistance
Through visual analysis of charts, individuals can identify specific price levels that tend to act as barriers, preventing prices from declining further before rebounding. These levels are commonly referred to as price support levels.
Similarly, users can observe price levels that consistently act as a ceiling, causing prices to retreat after testing those levels.
These are known as price resistance levels. By recognizing these support and resistance levels, traders and investors can gain insights into potential price dynamics and make more informed decisions regarding buying or selling actions.
Stock Volume
Volume is a metric that quantifies the total number of shares traded during a specific timeframe. It serves as an indicator of market interest and can have a substantial impact on price movements.
High volume suggests significant trading activity, often leading to breakout or breakdown scenarios with sustained price trends. Breakouts typically result in upward price trends, while breakdowns lead to downward price trends.
Conversely, when the volume is low, stocks often show a range-bound behaviour known as consolidation, where prices fluctuate within a defined range. Analysing volume can provide valuable insights into market dynamics and help traders identify potential trading opportunities.
Trends
Trends reflect the prevailing direction of stock prices. An uptrend occurs when stock prices consistently increase over time, indicating rising demand as buyers are willing to pay higher prices while supply diminishes.

Conversely, a downtrend occurs when stock prices consistently decline, reflecting an oversupply of shares and waning buying interest. By connecting the significant high and low points on a chart, trend lines can be manually drawn to identify levels of support and resistance, as well as the overall direction of stock prices.
By comparing these trend lines to historical patterns, it may be possible to forecast future direction, turning points, and price targets. Analysing trends can help traders and investors make informed decisions about potential market movements.
Technical Indicators
Plotting data points on a chart provides a visual representation of stock price direction, but for in-depth analysis, additional data processing is required.
In the past, this analysis could take hours to complete manually, but modern charting and trading platforms have made it much faster and more efficient.
These platforms offer a wide range of technical indicators that can be applied to charts to analyse trends.
For example, moving averages are dynamic lines that connect the closing prices of each period, providing a visual tracking of trends. Charting and trading platforms also allow users to draw their own trend lines directly on the charts.
Different traders may have varying trend lines based on the chart’s time frame and chosen starting point. These advanced tools and features empower traders to conduct detailed analyses and make informed decisions in a more streamlined manner.
Price indicator
Price Indicators, such as moving averages, pivot points, trend lines/trend channels, Ichimoku clouds, three-line break, point and figure, etc. provide price-based information like demand and supply, trends. They are widely used and displayed on the price portion of charts to aid in technical analysis.

Momentum indicator
Momentum indicators measure the momentum of a stock and identify overbought or oversold conditions. They are available as pre-programmed tools on most charting and trading platforms.
These indicators assist traders in optimizing their entry and exit timing. By using momentum indicators effectively, traders can avoid chasing prices when overbought conditions are indicated, such as when a stochastic indicator peaks and falls below the 80 level.
While price is important, understanding how price levels are reached holds significant value. Some commonly used momentum indicators include Stochastic, Relative Strength Index (RSI), and Commodity Channel Index (CCI). These indicators provide information on the strength and direction of price momentum, aiding traders in making informed decisions.
Conclusion
Technical analysis plays a crucial role in optimizing the analysis of price movements, helping traders make informed decisions. The science of successful trading involves finding the right mix of indicators and employing them in a prudent and disciplined manner to enhance the trading process. Combining price and momentum indicators can be a valuable approach to generating reliable entry and exit signals in trading. By utilizing a suitable blend of technical indicators, traders can identify high-probability trading setups and triggers, while also implementing disciplined trade management practices.
Contain & Image ©️ Copyright By, Trading Fuel || Research Lab