What are Pivot Points?
Pivot points analysis is a famous technique that is used as a price forecasting method for day traders and professional traders as well. It is very popular among professionals.
You should have a better understanding of this method after studying this module and the benefit to you may help improve your timing of entry and exit points of the market.
So traders use pivot points as a guide to support and resistance level for their trading. There are 4 support and resistance price levels around the pivot.
Support and resistance, price range forecasting pinpoints top and bottom and target trading are some of the terms that are used to refer to it as well.
How To Use In Pivot Points Intraday Trading?
Time frame:
Pivot points for 1,5,10 and 15 minutes charts use the prior days high, low and close. In other words, pivot points for today’s intraday charts would be based solely on yesterday’s high low, and close. Once pivot points are set they do not change and remain in play throughout the day.

How to Calculate Pivot Points?
First here is the Pivot Points mathematical formula where p= pivot point; c= close: h=high: and l=low.
Pivot points (pp)=(high+low+close)/3
First level support and resistance:
Second level support and resistance:
Third level support and resistance:
Consider the pivot points as the averages of the previous session’s trading range combined with the closing price.
The number of support and resistance that are calculated indicates the potential range for the next time frames based on the past weight of the markets strength or weakness derives from the calculation of the high, low, and distance from the close of those points.
Pivot points analysis is also used for identifying breakout points from support and resistance number.
Advantages of Pivot Points Trading:
We can use daily pivot points to identify the next day’s potential range or supports and resistance. It helps us to plan the next day’s trade. Similarly, the weekly pivot is done at the end of every week and the same goes for the monthly pivot.
The concept is this as technical analysts we are trying to use past price behaviors to help us indicate future price direction.
But here we are not trying to predict the future we just want an idea of where the price can go in a given period based on where they have been.
Pivot Points Trading Strategy as a Market Sentiment:
In pivot points trading pivot points is most important and it helps us to catch overall market sentiments for the days.
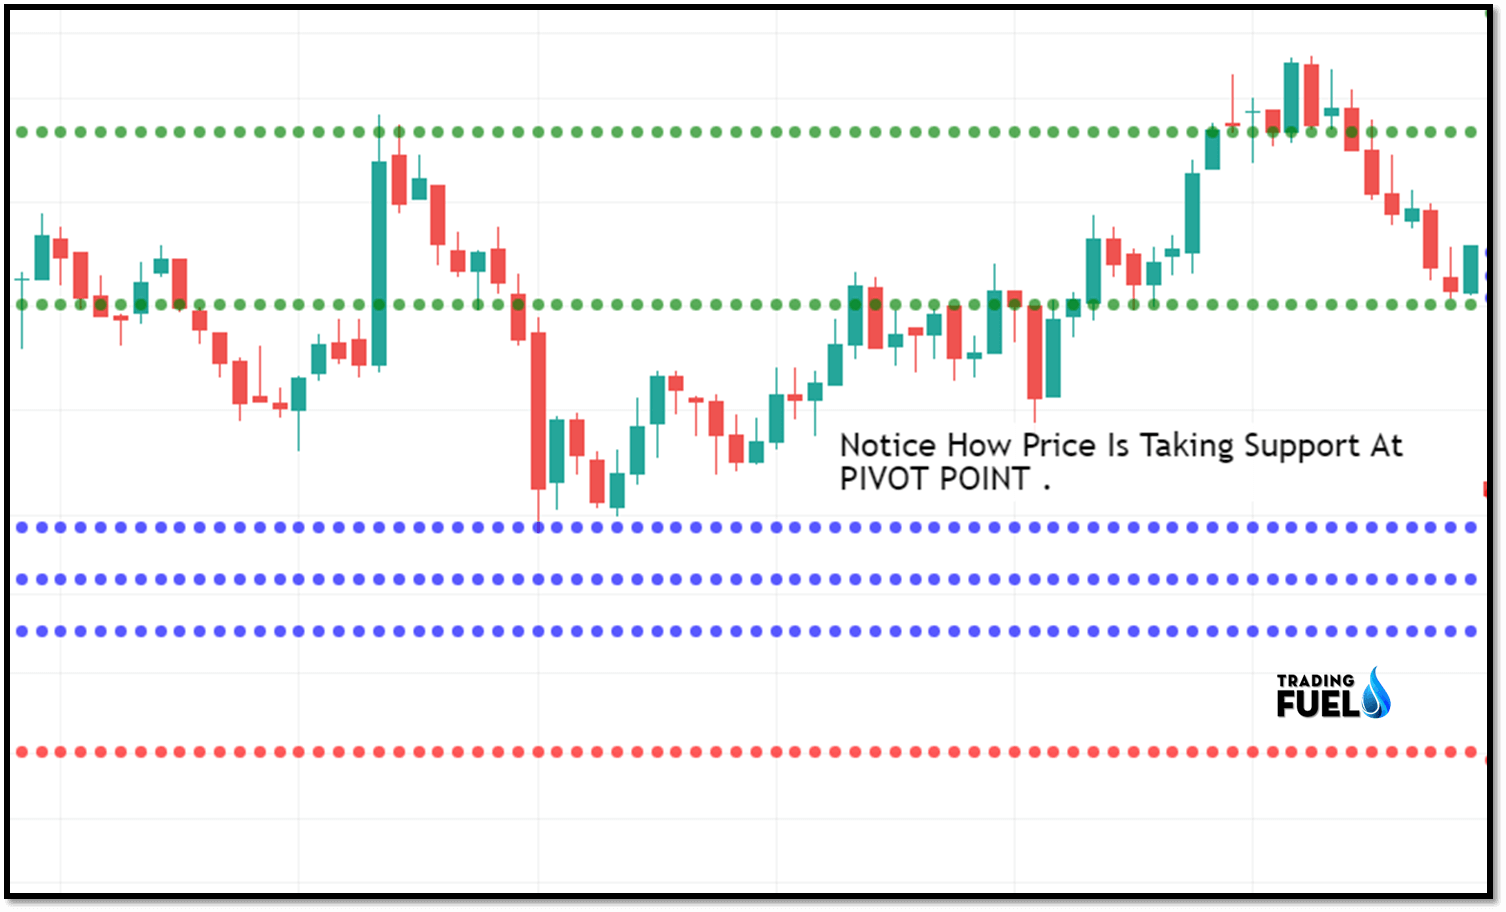
If price breaks through the pivot point to the top, it’s a sign that traders are bullish on the stock or commodity and you should start buying.
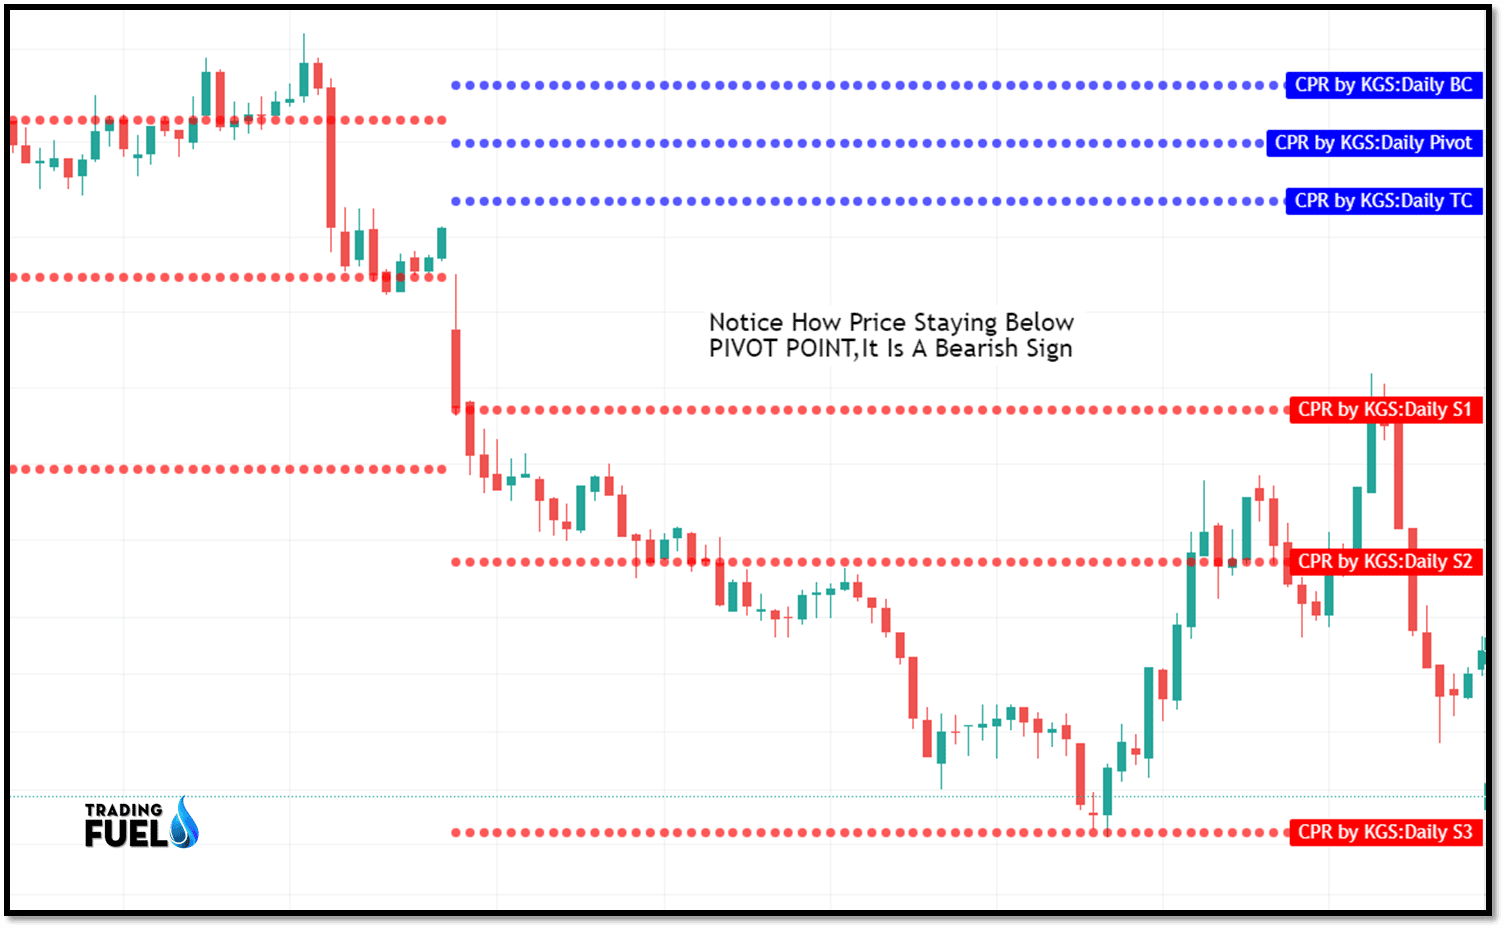
If the price break through the pivot points to the bottom then you should start selling the stock. The price being below the pivot points would signal bearish sentiments.
Of courses, it doesn’t always work out like previous charts there are times when you think that traders are bearish on a stick, only to see that the stock reverses and breaks through the top.
This is why you cannot simply buy when the price is above the pivot points or sell when it is below it.
Instead, if you choose to use pivot points analysis in this way, you should combine it with another indicator to help you determine overall market sentiments.
Pivot Points Trading Strategies:
Pivot points are important values in our pivot trading.
Look at the price of stock at 9:45-9:50 AM.
In pivot, trading keeps the target of 0.75% or 1% and puts a stop loss of 0.5%.
Placing stops and targets using pivot points
1. Pivot Points Trading Strategy:
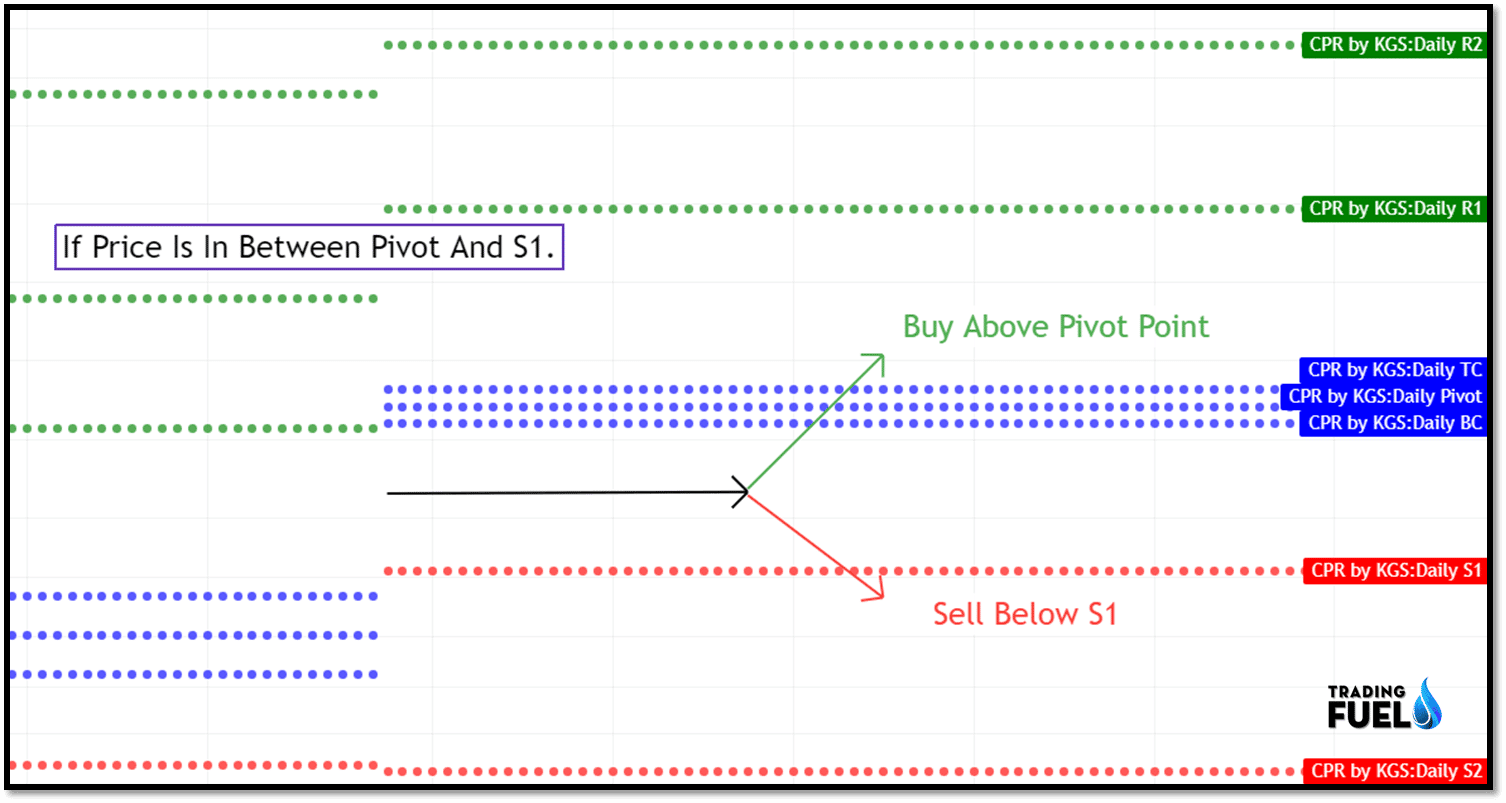
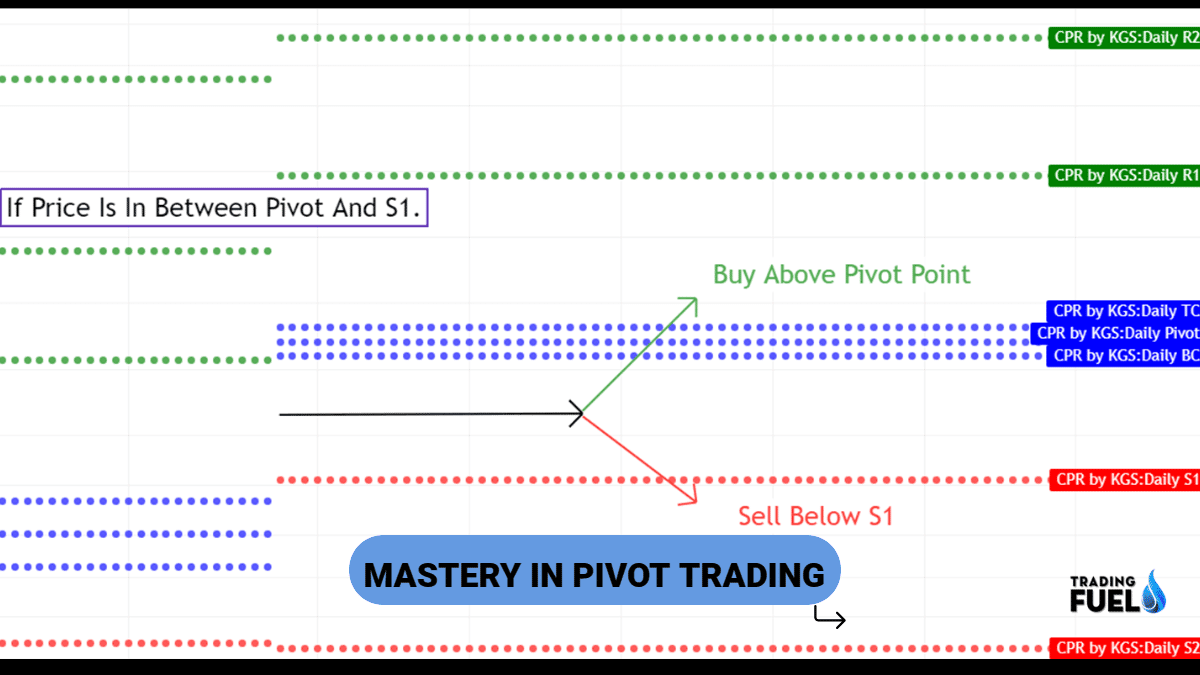
- If the price is below the Pivot but above S1.
- In this scenario, you should buy the stock above the pivot and sell below S1.
2. Pivot Points Trading Strategy:

- If the price is above the pivot but below R1.
- In this scenario, you should sell the stock below the pivot and buy above R1.
3. Pivot Points Trading Strategy:

- If price is very near to pivot (+- 0.02%)
- In this scenario, you should buy the stock above R1 and sell below S1.
4. Pivot Points Trading Strategy:

- If the price is between R1 and R2.
- In this scenario, you should buy the stock above R2 and sell below the pivot.
- You should not that selling below the R1 level is not advisable, as it can lead to loss due to the wrong setup.
- You must sell below Pivot.
5. Pivot Points Trading Strategy:
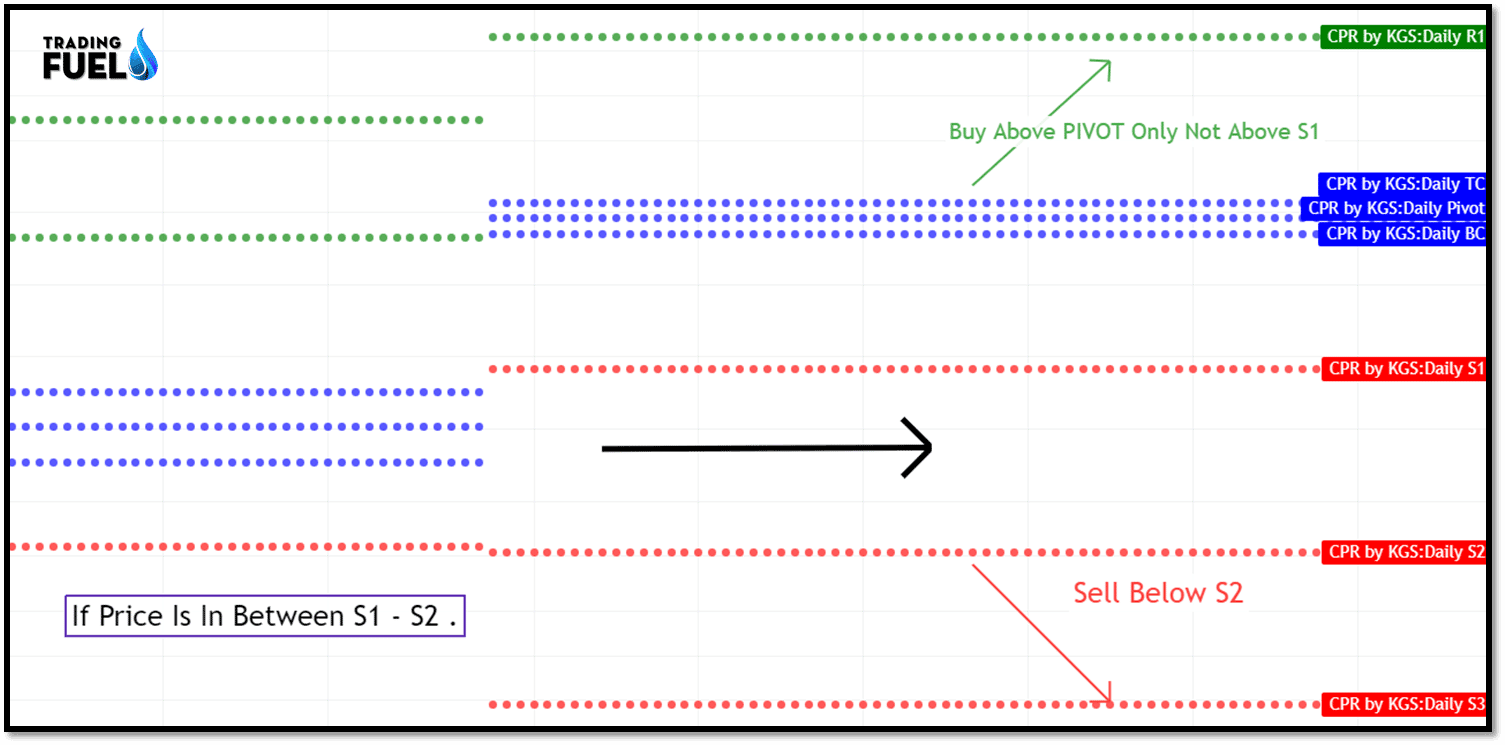
- If the price is between S1 and S2
- In this scenario, you should buy the stock above the pivot and sell below S2.
- The important here is not to buy above S1, buy only above the pivot.
Trade Like a Pro:

The above chart is of the nifty index. This image illustrates bullish trade taken based on pivot point breakout trading strategy.
The first trade is marked on the chart when the price breaks the R1 level and closed above it. We go long and we place a stop-loss order below the R1 pivot level. As the price closes above the R1 level, the price rises sharply with high momentum.
We told the trade until the price reaches the next pivot level R2, or R3 it may experience resistance near the higher pivot level. Breakout of this pivot is very critical for the trend to continue otherwise price can reverse its momentum.
Price while breaking through R2 presents us with other opportunities to enter into another long trade.
Pivot Point Breakout Trading:
To identify pivot point breakout trade, you should be looking for a breakout of the pivot level that can either be a support level or a resistance level. For a long position, one can trade when the price breakout through a pivot point level. This breakout will most likely occur in the morning.
If the breakout is bearish then you should initiate a short trade, after the price break support level.
While trading a breakout trade, you should not forget to place a stop loss, this way your trade will always be secured against unexpected loss. A good place to keep stop loss would be the top/bottom which is located somewhere before the breakout.
The target for pivot point’s breakout trade is most likely to be the next pivot point level. If one entered a long position after the price break R1, stop loss will be below R1 and the next immediate target will be R2.
Summary:
Pivot points are a technique used by a trader to help determine potential support and resistance area.
There are four main ways to calculate for pivot points: standard, woodie, camarilla, and Fibonacci.
Pivot can be extremely useful in stock, commodity, forex because usually, the price fluctuates between these levels. Most of the time price ranges between R1 and S1.
Pivot points can be used by range, breakout, and trend traders.
Range bound trader will enter buy order near the support level and sell order near the resistance level.
Pivot points also allow the trader to filter out the share that lacks the momentum to broke key levels.
Contain & Image ©️ Copyright By, Trading Fuel Research Lab