Strategics Tools:
- Bollinger band
- Stochastic oscillator
Before going to our trading strategy first we learn about indicators and check how they can help us in trading.
Both Bollinger band and stochastic help us in successful trading, one works as an indicator and the second as confirmation.
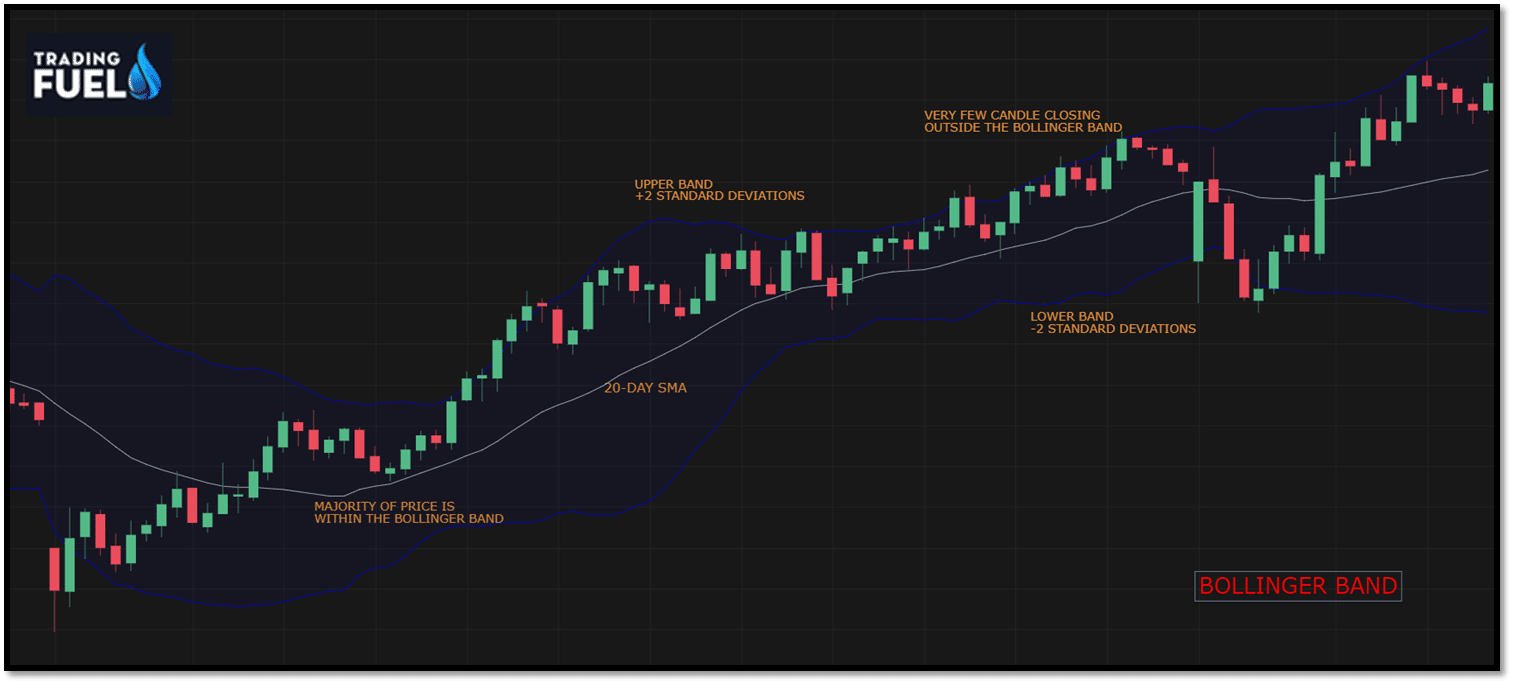
Standard Bollinger Band Settings:
- Middle band: Created by 20-period simple moving averages.
- Upper band: Created by the central band plus two standard deviations.
- Lower band: Created by central band minus two standard deviations.
- Bullish: When the price closes above the 20 period moving averages (middle band) of the Bollinger band, such market is bullish.
- Bearish: When the price closes below the 20 period moving averages (middle band) of the Bollinger band, such market is bearish.
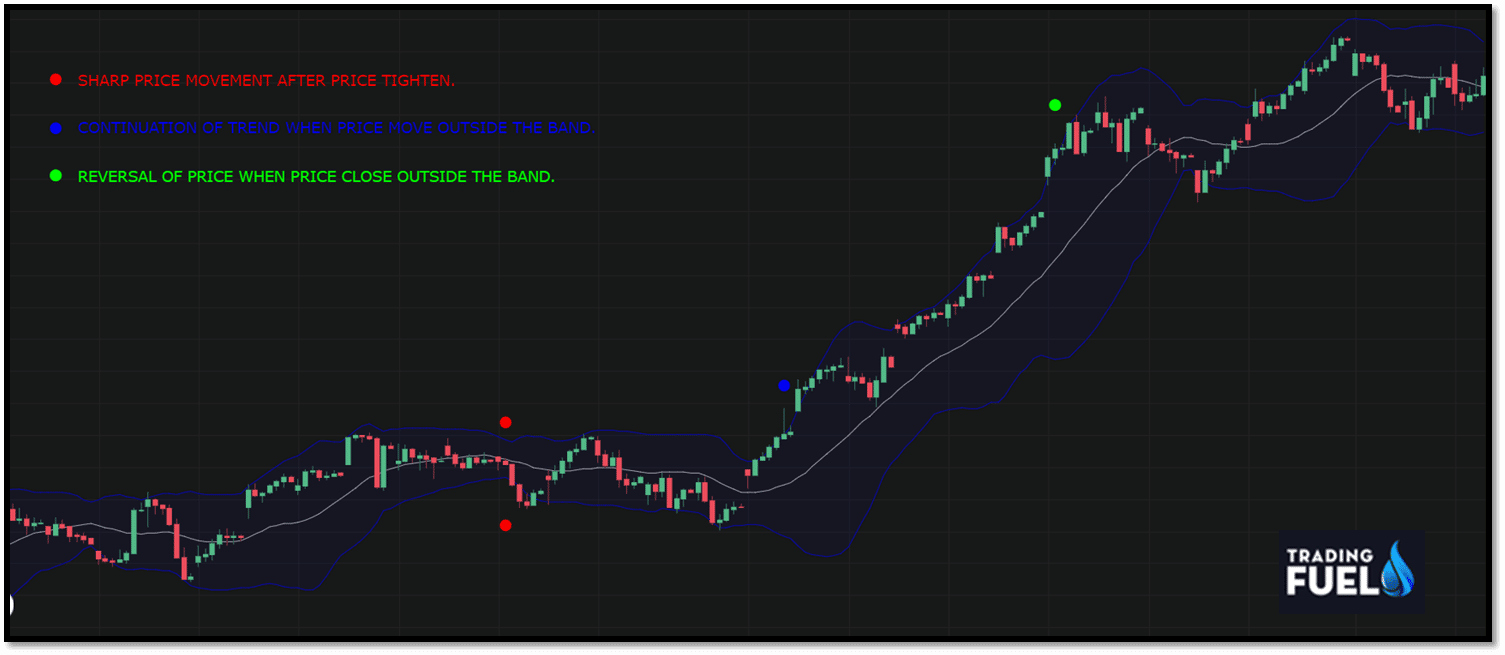
- When the price is near the upper Bollinger Band in such a way it either penetrate or touches the upper band, and stochastic is below 80, it is an indication of the continuation of the trend.
- When the price is near the lower Bollinger Band in such a way it either penetrate or touches the lower band, and stochastic is above 20, it is an indication of the continuation of the trend.
- When the price is near the upper Bollinger Band in such a way it either penetrate or touches the upper band, and stochastic is above 80, it is an indication of reversal or decline of trend.
- when the price is near the lower Bollinger Band in such a way it either penetrates or touches the lower band and stochastic is below 20, it is an indication of reversal or decline of trend.
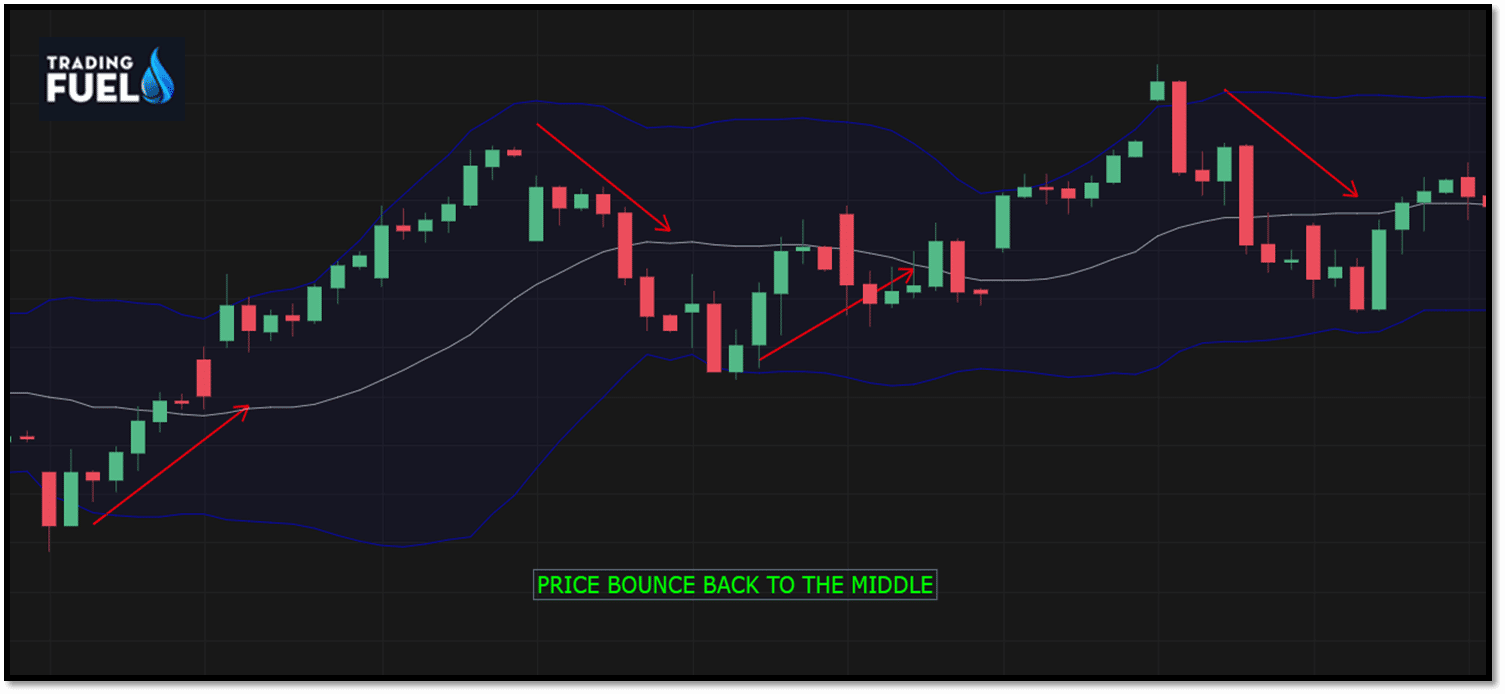
Bollinger Band:
The Bollinger band works on the principle of mean reversal ie, price tends to a reversal back to its mean (middle of the band). While developing the strategy we use this idea of Bollinger bounce.
- The price most of the time retrace back to the middle region of the band which is the 20 period MAs.
- The cause behind this bounce can be any fundamental change, but in the context of the Bollinger band, the outer boundary (bands) act like dynamic support and resistance levels.
- The accuracy of these bounce and trading setups is more accurate on the higher degrees. Daily, weekly, or monthly time frames.
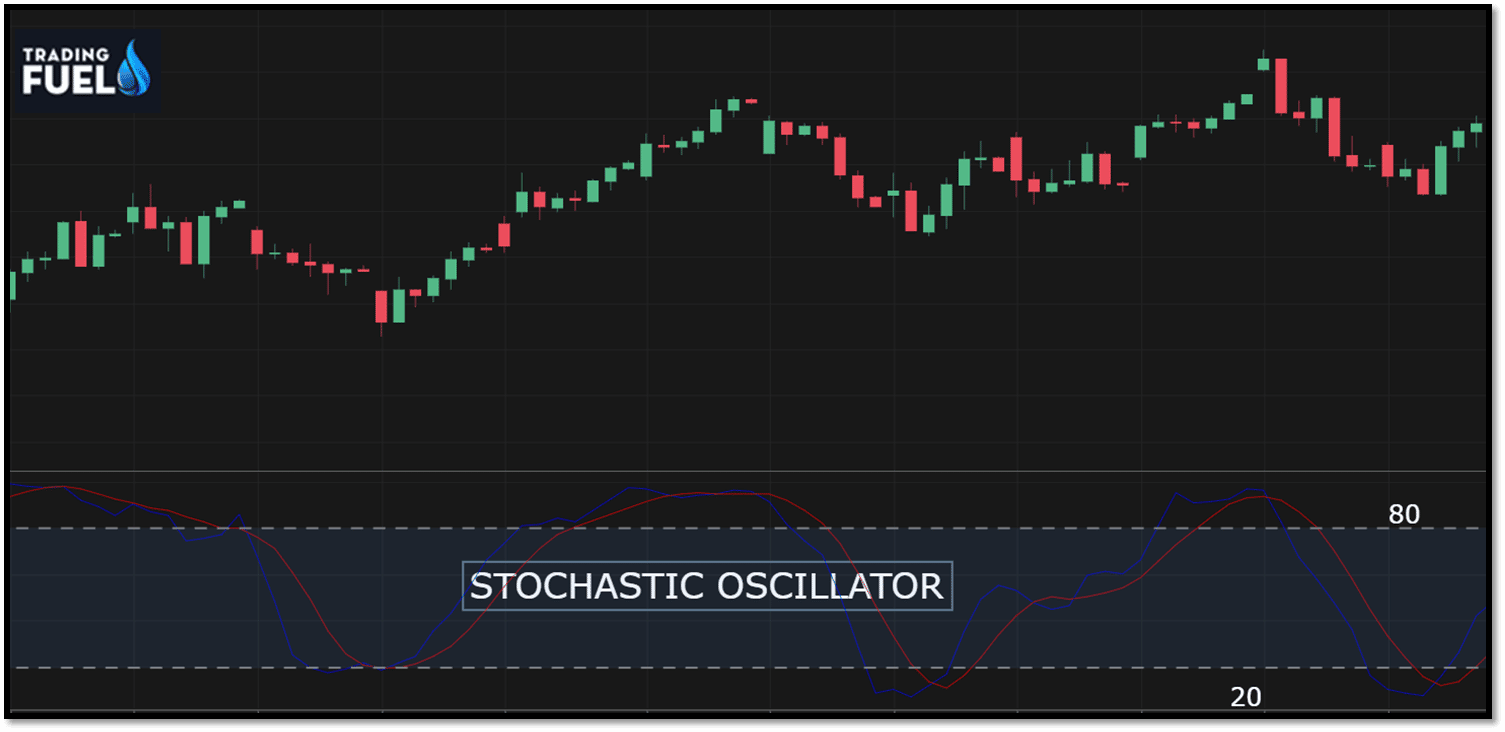
Stochastic Oscillator:
- The stochastic is another indicator that we use for confirming signal, either a trend is ending or the price is giving the wrong signal.
- By definition, a stochastic is an oscillator that measures the brought and oversold condition in the market.
- The 2 lines of stochastic are similar to the MACD lines as one line is faster than the other to measure the short-term movement of price.
Trade using Stochastic:
- Stochastic tell us when the market is overbought and oversold.
- The stochastic is scaled from 0 to 100.
- When the Stochastic lines are above 80 then it means the market is over brought.
- When the Stochastic lines are below, then it means that the market is oversold.
- As a rule of thumb, we buy when the market is oversold and we sell when the market is over brought.
- The main purpose of the indicator is to show us where the market condition could be over brought or oversold.
- Bullish: %K and %D lines fall below and then rise above the 20 range of stochastic, it’s an indication of a potential upcoming bullish trend, when %K line cross above the %D line, it triggering a bullish signal which here we use as a confirmation signal in our trading system.
- Bearish: %K and %D lines rise above and then fall below the 80 range of stochastic, it’s an indication of a potential upcoming bearish trend, when %K line cross below the %D line, it triggering a bearish signal which here we use as a confirmation signal in our trading system.
The stochastic indicator is oscillating that compares two lines the %K and %D lines to determine the chances of an uptrend or a downtrend. In price charts, the %K line is marked as a solid line, and the %D line is marked as a dotted line. The stochastic oscillator can be used effectively to differentiate between the daily, weekly, or monthly trends.
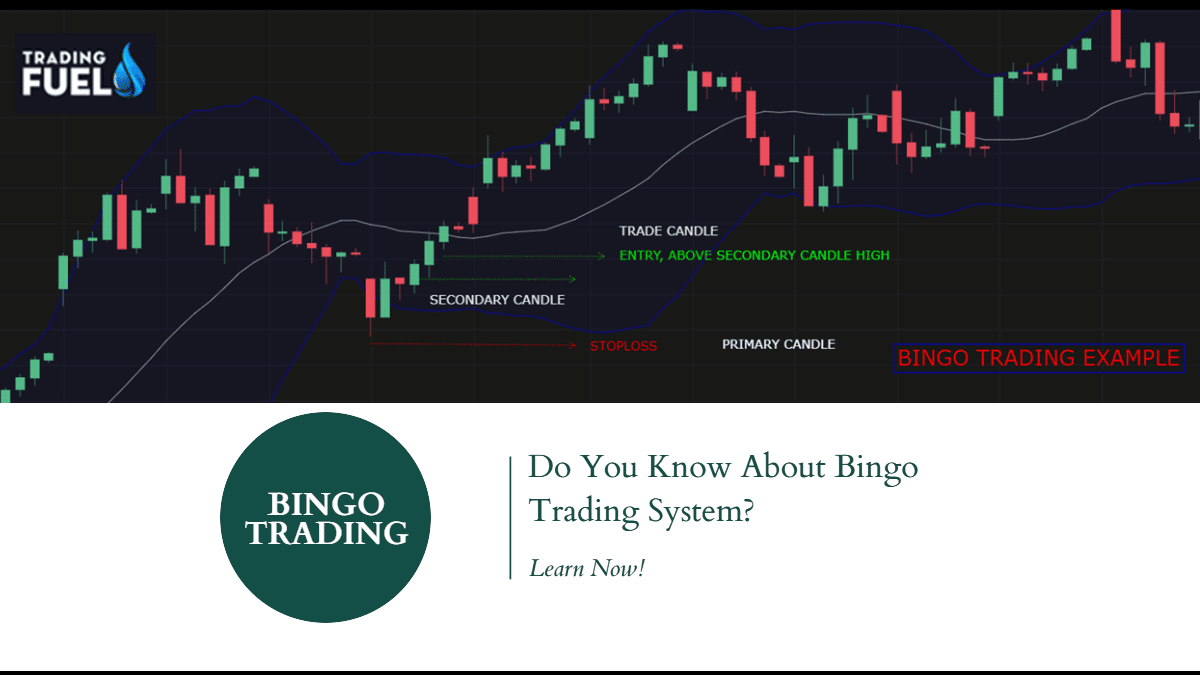
Rules:
In this strategy, we consider a candle before commencing any trade.
- Primary candle.
- Secondary candle (used for confirmation).
- Trade candle.
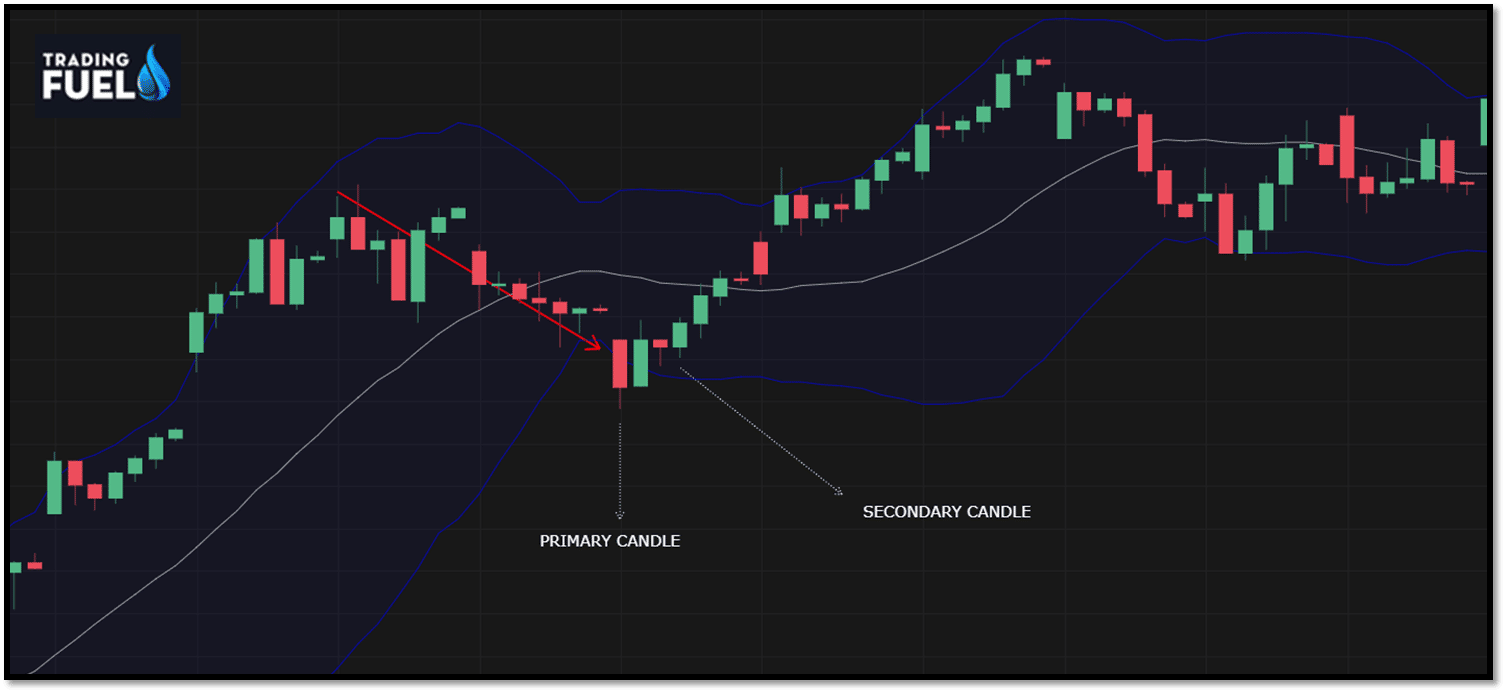
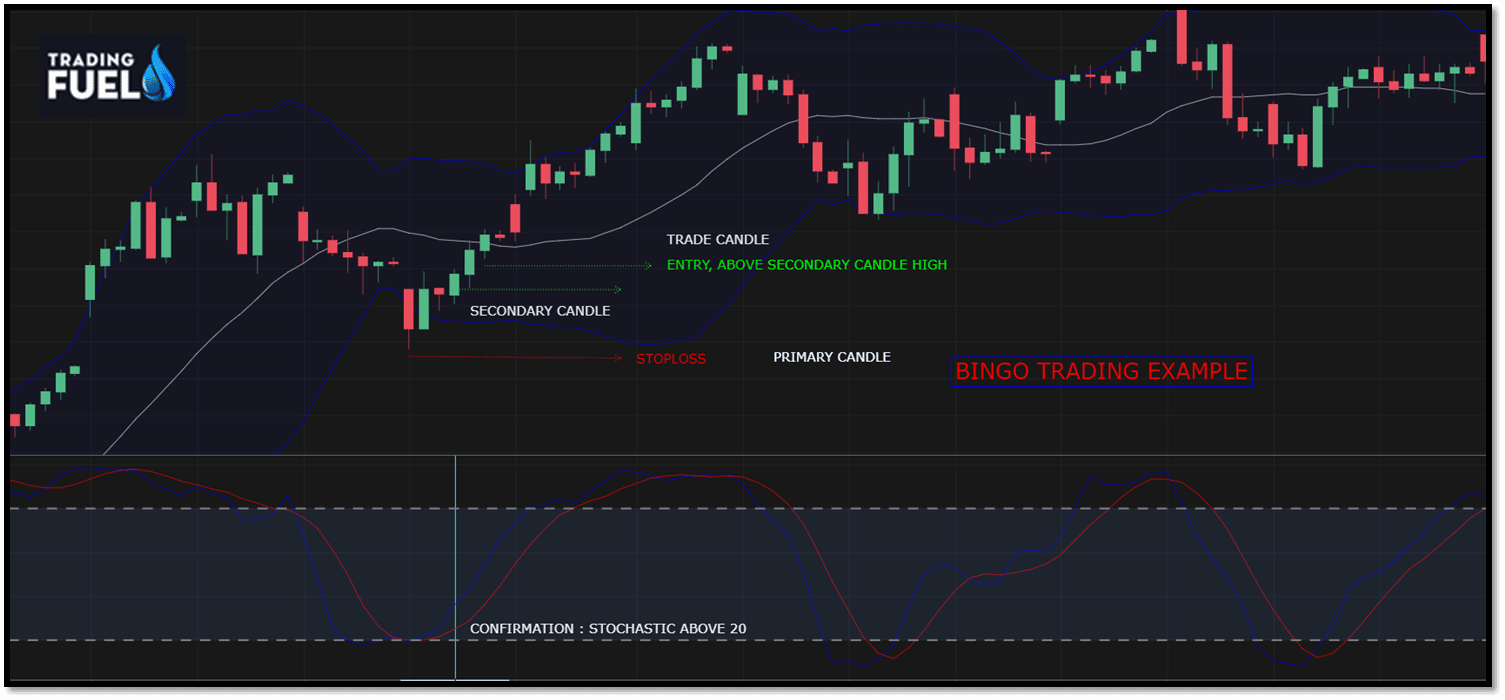
Primary Candle:
- As we know when the market fall, may candle touches the lower Bollinger band continuously.
- The primary candle is the last candle that penetrates or touches the lower band during its downtrend.
- It must be noted that the color of the primary candle is not important, can be green or red.

Secondary Candle:
- The secondary candle is the one that occurs after the primary candle.
- It must be a bullish candle.
- Close above the previous candle body.
- It’s very critical to note that the secondary candle cannot touch the lower band, otherwise it’s not a valid second candle.
- These features indicate that the stock is trending higher after taking support at the bottom.
Trade Candle:
- Initiate the buy/long trade and place stop loss just below the low of the first candle.
Note: At times continuously 4-5 candles touch the lower Bollinger band. Please note that the last candle which touches the lower band must be taken into consideration as a primary candle.
Bingo Setup:
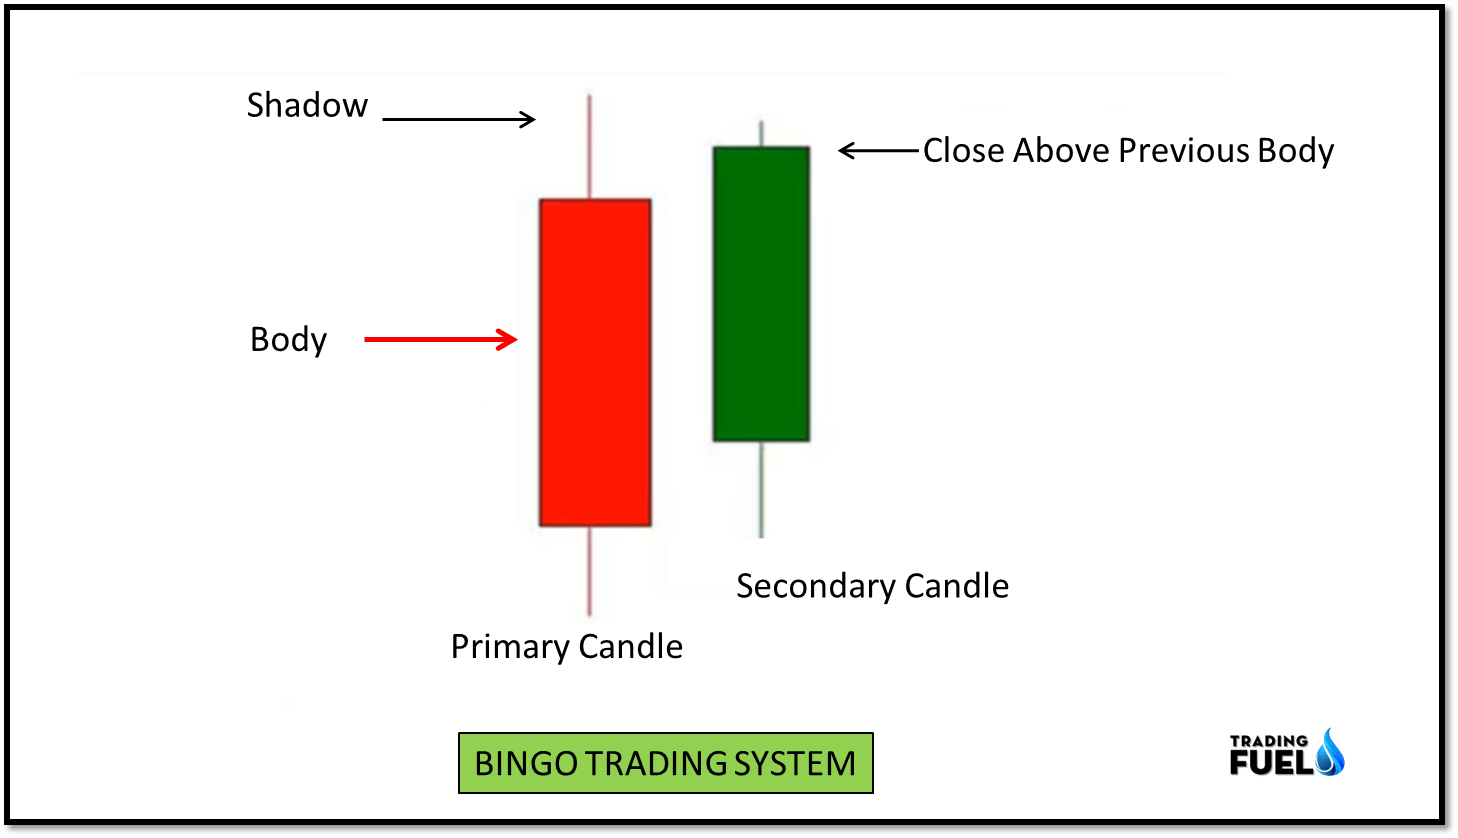
Necessary condition: The secondary candle body closes above the previous candle body. No need to close above the shadow.
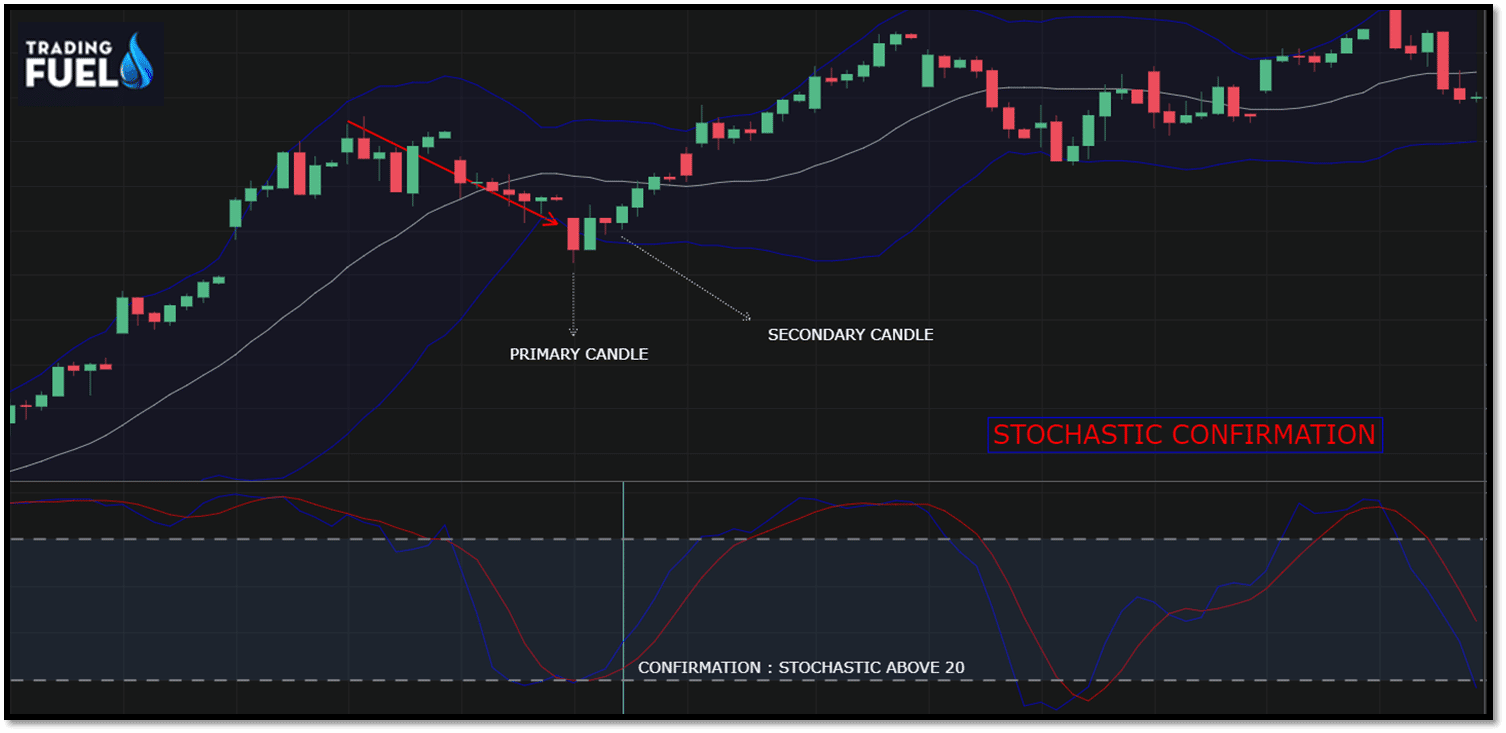
Confirmation: (Stochastic Indicator)
The trade can be confirmed with the help of a stochastic indicator as this too is a trend reversal indicator. Make sure %K faces upward and starts traveling from 20 towards 100.
Procedure for short selling:
- The primary candle is the last candle, after which the trend is about to reverse, primary candle touches the upper Bollinger band. The color of the primary candle does not matter it can both read and green consideration.
- The secondary candle must be red, representing the presence of a bear, and close below the high of the previous candle, it confirms the trend reversal.
- Under any condition, the second candle to be considered as a confirmation candle must not touch the upper band.
- Trade candle- sell initiation to be taken at the start of the third candle with a stop loss just above the high of the primary candle.
- Trade confirmation: stochastic oscillator must face downward and start traveling from 80 toward 0.
Summary:
- This technique can be applied to equity commodity, forex market for intraday, short term and long term trades irrespective of market and time frame.
- In the whole methodology, the confirmation candle is a very important step to be followed; which decides the trend.
- In many cases, the secondary candle does not close completely above the previous one or does not close completely below the previous one.
- Never initiate a trade in such a case as it indicated, the market is not in the mood to change its trend.
Contain & Image ©️ Copyright By, Trading Fuel Research Lab