Bollinger Bands are a technical analysis indicator that is developed by John Bollinger. It is useful for finding overbought/oversold areas and also helps traders to identify the market volatility. It is commonly used as a reversion to the mean indicator. It means that if the price is below the bands, the price is currently low and if the price is above the bands, it is interpreted as too high. During the high volatile market, Bollinger bands will widen and when there is low volatility, the bands contract.
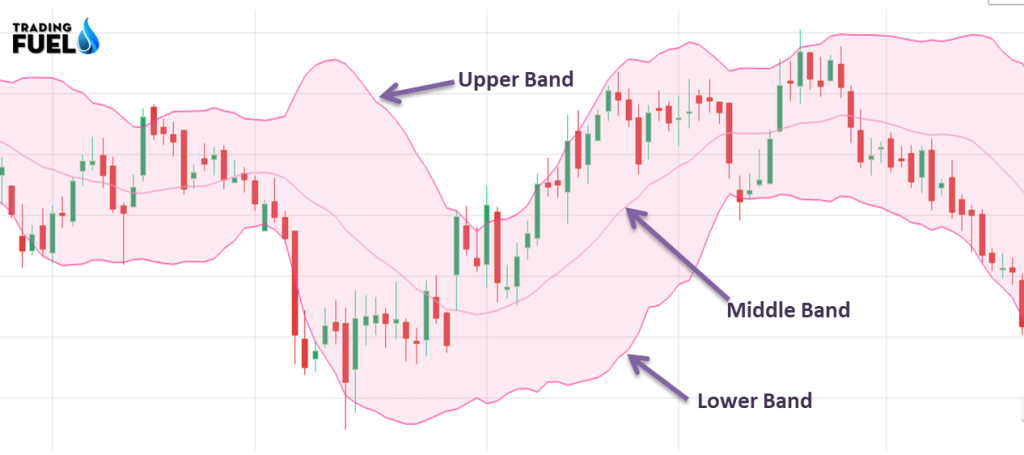
When you apply Bollinger bands in your chart, you will see three lines. Lines are nothing but based on the concept of simple moving average.
The upper band – middle band + 2(standard deviation)
Lower band – Middle band – 2 (standard deviation)
Middle band – 20 period moving averages
How to use Bollinger Bands?
Bollinger bands are popular technical analysis tools used by many traders .when the bands contract because of low volatility; it is called “squeeze’. This indicates upcoming bout of high volatility. t And if the bands expand, it can be interpreted as an upcoming period of low volatility.
Bollinger Band Squeeze
As we discussed, when the bands get close together as shown in the image –it is called a squeeze. Whenever traders find the squeeze, it is considered as a potential signal of an increase in volatility in the future and traders can get trading opportunities. This condition doesn’t give the trading signals.
Bollinger Bands helps traders to identify the volatility of the market, when you find squeeze in the bands, we can say that there is a low volatility environment in the market and huge move is expected after the breakout.

More Blogs on: Technical Analysis
Breakouts
A breakout above or below the bands occurs when there is a major event. 90% of price action takes place between the two bands. The breakout is not a signal for trading. Most people make a mistake when they find the breakout, they believe that price breaking the bands or exceeding one band is signal for buy or sell. Breakouts don’t provide any clue for the direction of future price movement.
Bollinger Bands Trading Strategy
1. How to Buy at Bottom and Sell at Top
If you want to become profitable in the market, just buy at the bottom and sell high. You can easily follow this buy at low and sell at top rule with the help of Bollinger Bands.
The upper and lower bands are 2 standard deviations from the middle line (mean). It means that if the price is touching the upper band, it is considered as the “expensive” and if the price is near the lower band, it is considered as “cheap”.
If you want to get a higher probability of winning trades, you need to follow a few steps.
- Check the price is in an uptrend so the lower band is also in an uptrend. (Vice Versa)
- Now look for the reversal candlestick pattern i.e. inverted hammer at the top, hammer at the bottom, etc. That gives the reversal signal.
- Here, the outer bands act as support and resistance.

2. Bollinger Bands and RSI
Bollinger Bands Indicator is useful for identifying the area of value on the chart, but it doesn’t provide the strength or weakness of the price move. So, here RSI plays an important role in this strategy.
Here, we will use divergence in RSI with Bollinger bands. Know more about Divergence.
For, buying opportunity: When the price is at lower Bollinger band and making bullish divergence with RSI (It provides the strength in the underlying move)
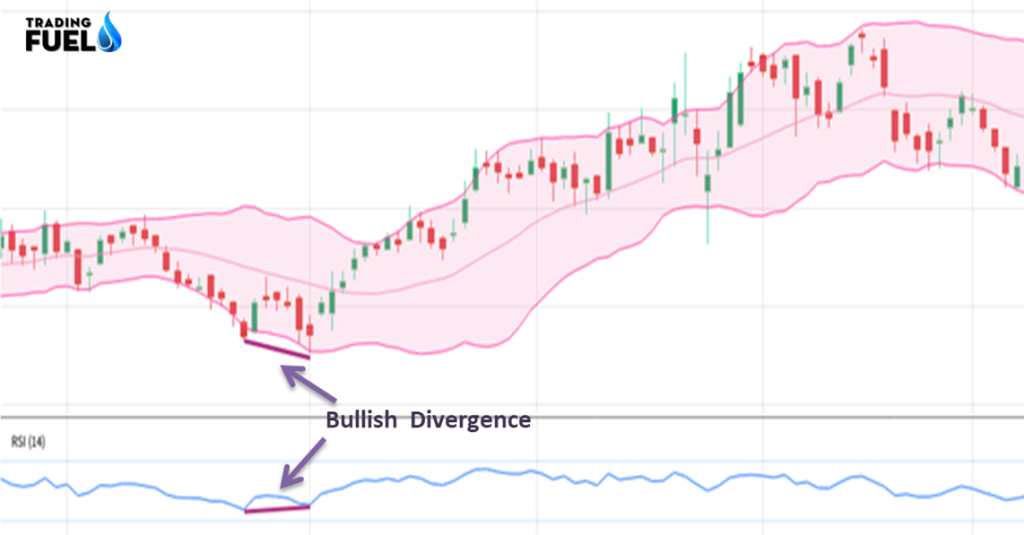
For selling opportunity: If the price it at upper Bollinger bands and makes bearish divergence with RSI (Again, it indicates the strength in underlying trend)

Pros
- Bollinger bands are useful to identify when the market is expensive or cheap. This indicator is very user-friendly and can provide traders another dimension for chart analysis.
Cons
Bollinger band is a lagging indicator so it cannot predict the price patterns, but they follow the current market movements.
This indicator indicates the overbought and oversold, conditions, but when the buying or selling pressure continues, Bollinger Bands don’t provide any signals so we cannot predict when buying or selling pressure will come to an end.
Note: We provide free stock market education through this website. Before using the strategies mentioned here, do back test by yourself. We are not responsible for any profit or loss made with our strategies.