Introduction: MACD Indicator
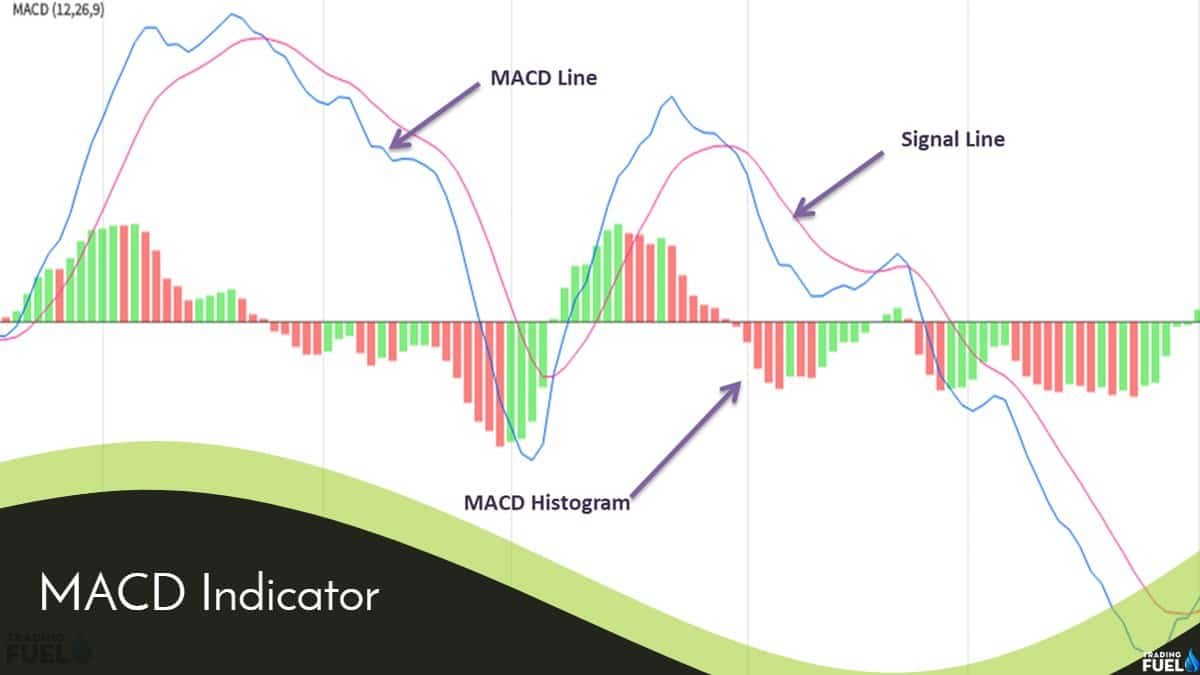
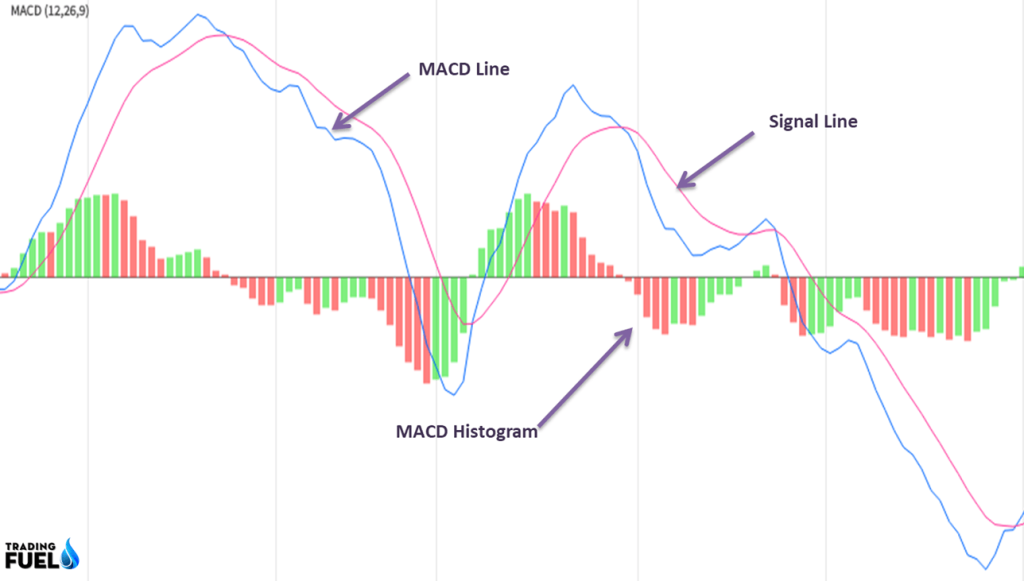
The Moving Average and Convergence Divergence (MACD) indicator is a lagging indicator used to follow trends, developed by Gerald Appel. It contains two exponential moving averages and a histogram.
The default settings for MACD are 12,26,9. Where,
MACD Line: 12 days EMA – 26 day EMA
Signal Line: 9-day EMA of MACD Line
MACD Histogram: MACD Line – Signal Line
Now let’s understand each component of MACD Indicator in detail,
- MACD Line: This line is nothing but the value of 12-day EMA minus the 26-day EMA.
- The Signal Line: This is the (historical value of the MACD Line) / 9
I.e. The values of MACD line are 1, 2, 3,4,5,6,7,8,9 and total of these values is 45.
So, the signal line = 45/9 = 5.
- MACD Histogram: This is the last component of MACD, that displays the difference between the value of the MACD line and minus against the Signal Line.
How to Use the MACD Indicator?
The MACD is the momentum and trend following indicator, so you can use the different signals given by MACD to predict the trend of the market. Let’s understand the different signals generated by the MACD Indicator.
MACD Hook
The MACD hook occurs when the signal line attempts to penetrate or penetrate the MACD line and turns at the last movements. In simple words, when the signal line and MACD line touches each other but don’t cross the Hook occurs.
The Hook identifies the counter-trend moves within the trending markets. To buy pullbacks in an uptrend and sell pullbacks in downtrend MACD hook will become helpful for traders. Hook helps traders to identify the potential trade setups. So it can be useful to conform to the setups.
For entering into a position, wait for the Hook to occur for the confirmation that a trend change has indeed occurred.
From the below example, you can see that during the downtrend, there is pull-back and at the same time the hook occurred. It confirms the pullback and trader can enter in to sell trade.

MACD: Moving Average Cross-over
The most popular use of the moving average convergence divergence is when the MACD line crosses the signal line up or down. The crossover of these two lines generates the signal that a trend may change the direction or it might be emerging.
The MACD Provides many cross-over signals, but do not take action on every signal. Use these signals if it follows the below condition.
- If The MACD is below the ZERO Line, and the signal line crosses above the MACD Line. Don’t go for a long position.
- And do not go for sell trade if the MACD is above the ZERO Line and the signal line cross above the MACD line.
From the below example you can see that during the up-trend, how the MACD stayed above the Zero Line.

Hidden Divergence
When the price moves in one direction (up or down) and at the same time indicator moves in the opposite direction, the divergence occurs. Hidden divergence is just opposite of the divergence.
Formation of Bullish Divergence: When the current low of the price is above the previous swing low and the MACD line make the opposite of the pattern. From the below chart, we can see the Bullish divergence.

Bearish Divergence: It is opposite of bullish divergence. When the price moves in down trend-making higher highs and lower high pattern, when the MACD makes the opposite of the pattern, a bearish divergence occurs.
MACD Histogram Squeeze
When the range of the price gets small and tight, when there is low volatility in the market – there are high chances of explosive breakouts. To spot the MACD Histogram helps the trader to identify that explosive breakout trades about to occur.
To find out this type of breakout, first, check that price comes into small range. At the same time, MACD Histogram looks flat as shown in the below image. You can enter into a trade when the price breaks the small range and same time Histogram expands.

Conclusion:
MACD is momentum and trend following indicator. Use the MACD Crossover to confirm the trends. MACD Histogram is useful to confirm the breakout and also it is useful for checking trend reversal. MACD indicator helps a trader to find the trading opportunities.
About us:
Trading Fuel is a blog site provides numbers of information on the topics related with the stock market and that too we are more specialized on Technical analysis and we had already written many strategies which can be useful for a trader and also many topics useful for the beginners to make the decision based on this. For the beginner, there are many blogs which will help them to decide whether they want to make a career in technical analysis and on which strategies it will be more useful for them.
Indicator Base Useful Blog:
One of our blog that is Top 5 intraday indicator is very useful and has been the most circulated blogs of our site. Our Blog site is solely for education and we are not charging anything for our materials. We had recently posted the ADX indicator and Keltner channel indicators which will be helpful for the professional as well as beginner traders to apply. All our blogs are very easy and simple to understand the content in it. For more interesting topics you can read more from Trading Fuel.