
Keltner Channel Indicator
The Keltner channel is a simple technical indicator. It is a volatility-based indicator that comprises of three separate lines. The middle one is an exponential moving average (EMA) of the price. The upper and lower band is set at two times the Average True range (i.e. 2 × ATR). As the volatility (Measured by ATR) expands and contracts, these bands expand and contracts. The upper and lower bands help to identify the overbought and oversold levels.
The Formula of a Keltner Channel:
The default setting of the Keltner channel is:
- Middle Line: 20-period Exponential Moving Average (EMA)
- Upper Channel line: 20 EMA + ( 2 × Average true Range)
- Lower Channel: 20 EMA – ( 2 × Average true Range)
The middle line can be taken as the mean and the upper and lower bands show how far the price is away from the mean.
How to trade with Keltner Channels
As we discussed, the Keltner channel is a technical indicator that helps a trader to measure the volatility of the market, asses the current trend and it also helps traders to spot the potential breakout. When you plot the Keltner channel indicator on the price chart, it will display the middle line, upper and lower bands, which creates the dynamic channel contains the price range inside the two bounds.
Now let us understand that how you can correctly interpret the Keltner indicator.
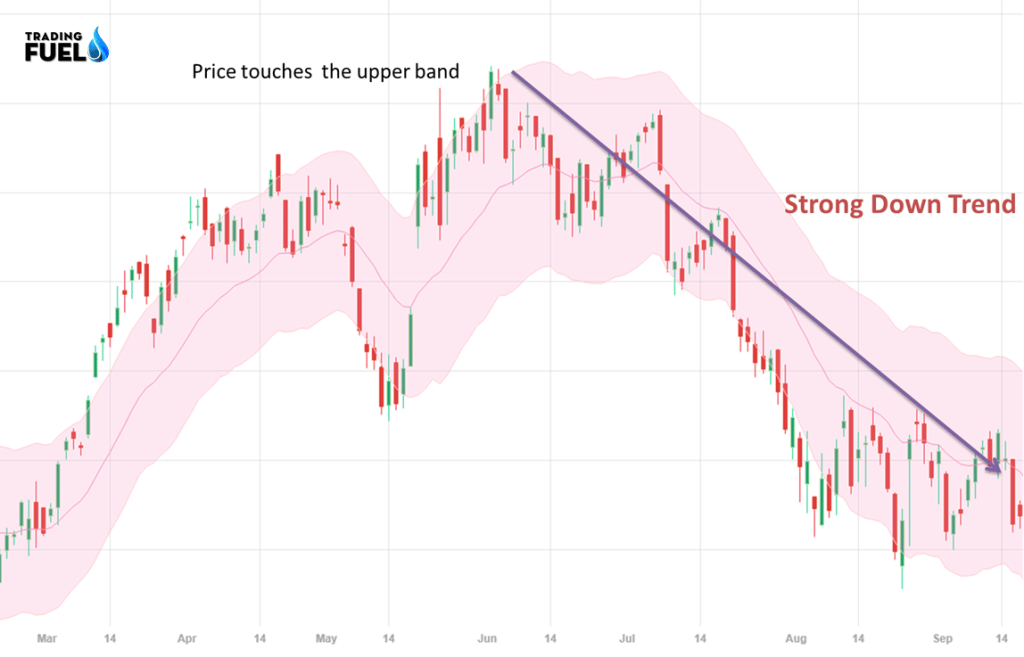
From the below image, you can see that when the price touches the upper band and also the upper line points upwards, it gives the strong signal of a bearish trend.
When the price moves in sideways and Keltner channels are flat and also moves horizontally, in this case, the price of the stock tends to bounce between the upper and lower bands.

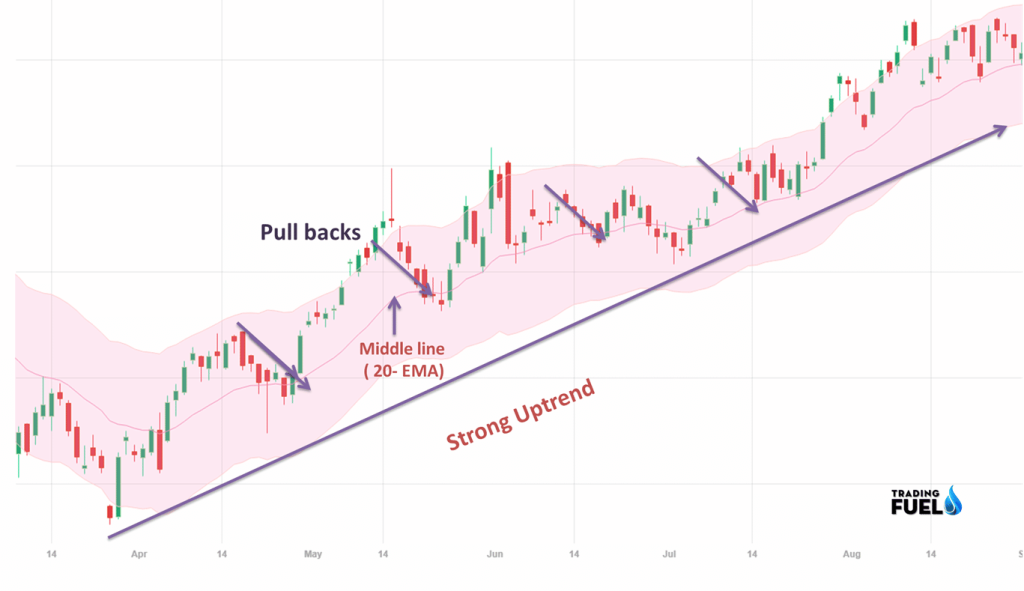
Keltner channel also helps traders to identify the pullbacks. It is preferable to measure the retracement of price with this indicator.
From the below image, you can see that during the strong upward trend, the price tends to bounce near the middle line (20- EMA).
Keltner Channel Trading Strategy
As we discussed, the Keltner channel is a very powerful indicator of breakouts. When the volatility rises this indicator gives the best performance.
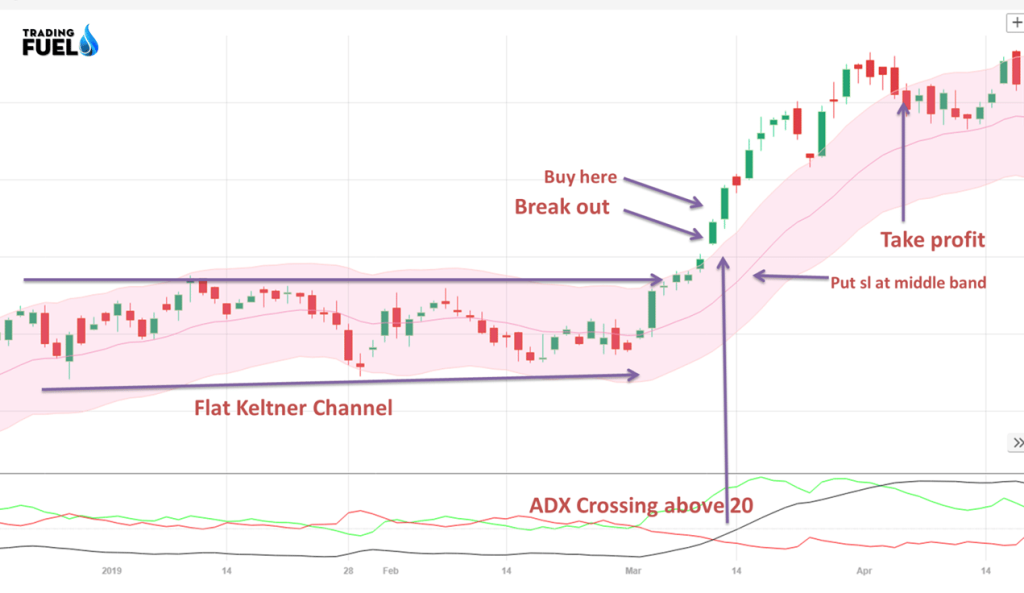
In this Keltner channel breakout strategy, we will use the ADX indicator as to the second tool for getting more accurate results.
Points to be noted in this strategy are:
- ADX indicator helps to measure the strength of breakout.
- When the ADX crosses the 20 levels, it gives the signal of the beginning of a bullish/bearish trend.
- Keltner channel bands need to be flat
- Price needs to break above the upper band (for buy trade)
- ADX should cross above the 20 levels.
- For the sell-side, the price needs to break the lower band and ADX should cross below the 20 levels.
Conclusion:
Keltner channel is similar to the Bollinger Band indicator. Both are enveloped-based indicators with the upper, lower and middle band but they both are calculated differently. When the price closes to the outside of the upper or lower channel there are high chances of reversal in trend. When the Keltner channel moves in a flat direction – that gives the signal that soon the price will break out