The Golden Cross Moving Strategy has grown in prominence among price action traders in recent years. Surprisingly, its popularity has also continued to surge even among fundamental traders, too.
Despite being ostensibly hard to grasp, it is actually very easy to evolve and highly effective to use. Hence, this strategy is worth adding to your trading toolkit. The guide here has been developed to help you exploit it for your use.
The Golden Cross Moving Strategy Defined
If you have not heard about it before, the Golden Cross Moving Strategy can sound a bit complex at first. You might wonder if it will not be too complicated for you to adopt. However, wonder not. It is really not difficult in any of the ways that you might think.
The strategy is named after a technical indicator, the moving averages, and combines the two of them to identify high-probability, tradable setups in the market. It can be applied to both stock and Forex/currency trading and the setups it identifies can be recognized in the form of trends and trade areas on the charts. The two moving averages of the indicator on which the strategy is based are:
- The intermediate-term moving average
- The long-term moving average
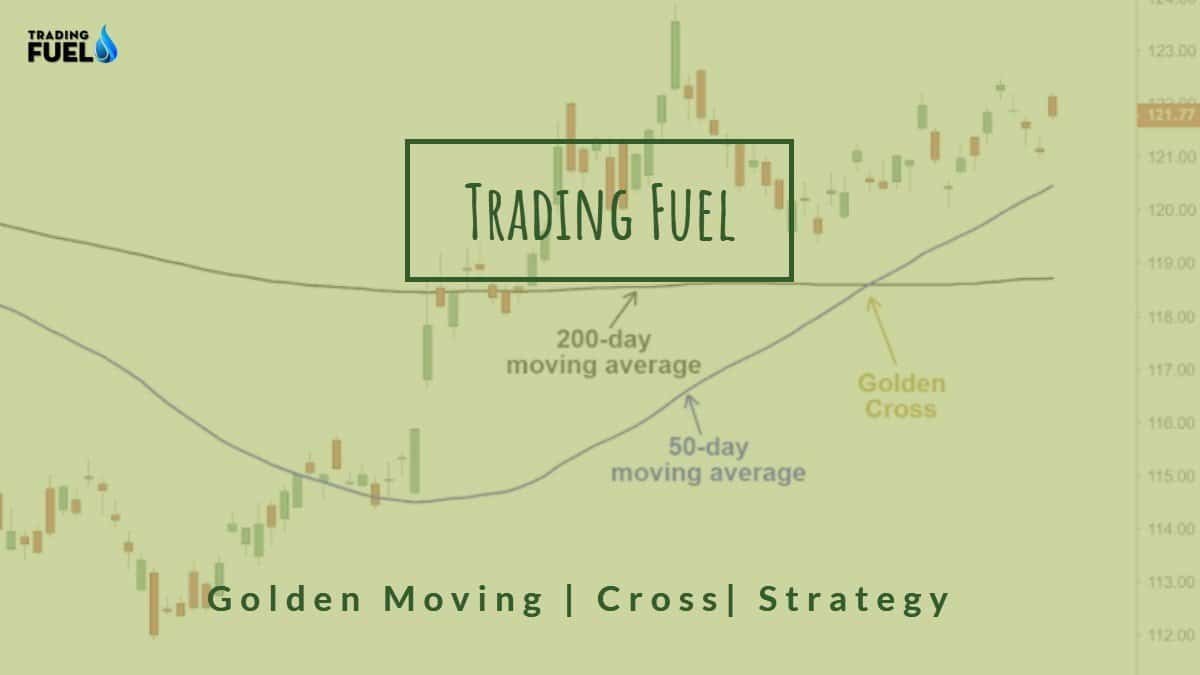
These two averages are plotted over a 50-day period and a 200-day period respectively. Notably, the two are the most important components of the Golden Moving Cross Strategy as it is their crossing over each other that signals opportunities in the market.

This crossing of the 200-day period moving average by the 50-day period moving average is known as the Golden Cross and is the fundamental basis for the signals that the strategy provides. It is interesting to note that you can use either the simple or exponential moving averages as your technical moving average indicator of choice.
How to Use the Golden Moving Cross Strategy
In using the Golden Moving Cross Strategy, you should not disregard price action. In fact, combining the strategy with price action to discover safe entry opportunities is advocated overusing them separately.
Then, you have to decide between either simple moving averages (SMAs) and exponential moving averages (EMAs). You should note that EMAs are more responsive than SMAs. However, they are more sensitive to short-term market bias, but less responsive to long-term market moves compared to SMAs.
Since our goal usually will be to have an intermediate to long-term view of the market, we will, therefore, prefer SMAs. Additionally, SMAs give more stable signals, which you will be able to take better advantage of. Nevertheless, it is fine if you prefer EMAs. No matter which one you use, the most important thing is to develop your expertise around it through consistent and appropriate use.
Now, to use SMAs, you have to know that the periods of the two moving averages are not rigid. Hence, you might want to vary them. The only precautions to guard against while doing so are:
- The two moving averages must be significantly varied far from each other. Because of the substantial difference between the two, the 50-day and 200-day periods are the most widely used.
- Since intermediate to long-term market moves are your target, you should ensure that both averages are not easily influenced by the short-term action of price.
- Importantly, not a single one of the two moving averages should be interpreted in isolation. This is why the crossover is so important. One has to cross the other before any meaningful analysis can be made.
The use of this strategy can be summarised into the following practical steps:
- First, watch out for the breaking of two consecutive trend extremes.
- Because the Golden Moving Cross is used mainly to generate buy signals, flipping from a support level to resistance is often the most considered.
- Note that as the distance between the two averages increases so does the momentum of the trend.
The Golden Moving Cross Strategy in Action
NIFTY 50 closed last week (December 16-20) on a positive note, inching up by 1.39%. During the week, it reached a high of 12,098.85, a low of 11,832.30, and eventually closed the week at 12,086.70, translating to a gain of 165.20 points.

Now, the index is trading above the 200-day period EMA. From the chart, the two EMAs are not widely varied yet, but they look like they will cross soon as they go higher up. Hence, the action of the price is suggestive of a short-term bullish move.
We, therefore, recommend a BUY for NIFTY 50 in the short term. However, if you want to predict the price action in the long term, all you have to do is to replace the EMAs with SMAs.
Conclusion
However, as effective as using the Golden Moving Cross Strategy is, you should ensure that it doesn’t distract you from the real thing on the charts: the action of price. To this effect, you should take some specific precautions such as:
- Never substitute the moving cross for your support and resistance. The fundamental tenet of technical analysis is that the price is the most important parameter to watch. Hence, your goal should be to trade price action itself, not to be distracted by any indicator.
As crucial as the formation of Golden Moving Crosses should be to your overall analysis, it should not replace the study of price action. Hence, even after the formation of moving crosses, you should still wait and check for the action of price to find low-risk entry points. So whenever you are in doubt about the direction of the market even after the Golden Moving Cross, just analyze the behavior of the price!