
What is RSI in Stock Market?: Relative Strength Index (RSI) is a momentum oscillator used in the analysis of financial markets, to measure the strength of an asset’s price action. It was developed by Welles Wilder, a mechanical engineer and commodity trader, in 1978.
It compares the magnitude of an asset’s recent gains to the magnitude of its recent losses and returns a value that ranges from 0 to 100. A value of 70 or above is considered overbought and signals that the asset may be due for a correction, while a value of 30 or below is considered oversold and signals that the asset may be due for a bounce. The RSI is a popular tool used by traders and investors to help identify potential buying and selling opportunities in financial markets.
How it’s calculated?
The Relative Strength Index (RSI) works by calculating the average gains and losses of an asset over a specified number of periods (usually 14) and then compares the average gain to the average loss. The resulting value is then adjusted to fit within the 0 to 100 scale.
Here’s the formula for calculating RSI:
RSI = 100 – (100 / (1 + (Average Gain / Average Loss)))
The average gain is calculated by adding up the gains from all of the up periods in the specified time frame and dividing by the total number of periods. The average loss is calculated in the same way, but with the losses from all of the down periods.
Once the RSI value is calculated, it can be used to identify potential overbought or oversold conditions.
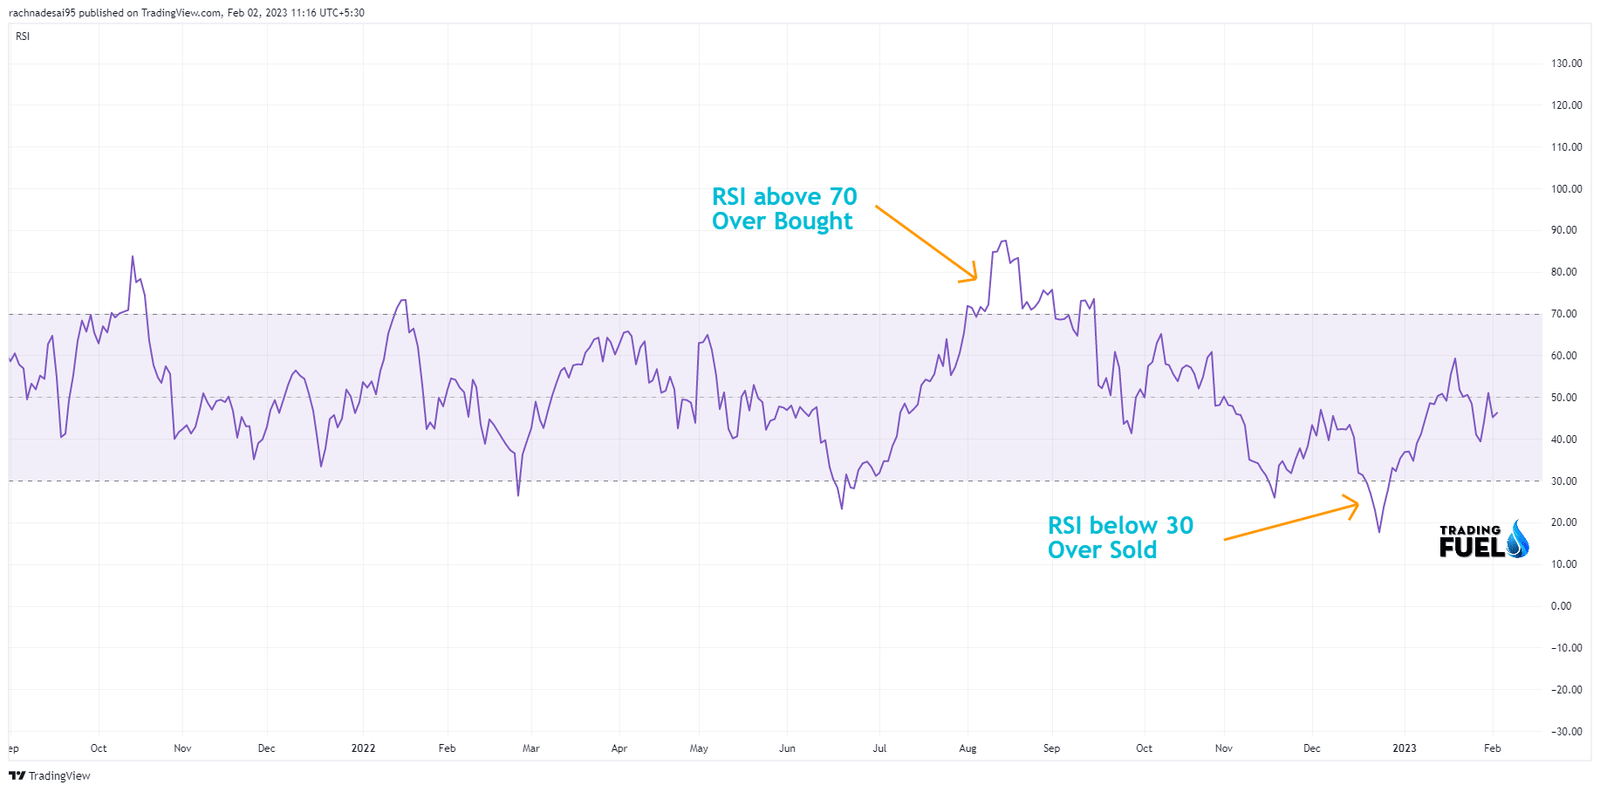
A value above 70 is considered overbought, indicating that the asset may be due for a correction.
A value below 30 is considered oversold, indicating that the asset may be due for a bounce.
You also like: Best Intraday Trading Indicators
Use of RSI
- RSI can also be used to identify divergences, which occur when the direction of the RSI and the direction of the price chart are moving in opposite directions.
- A bullish divergence occurs when the RSI is making higher lows, while the price of the stock is making lower lows. This divergence suggests that the underlying momentum is bullish and that the price of the stock could start to move higher.
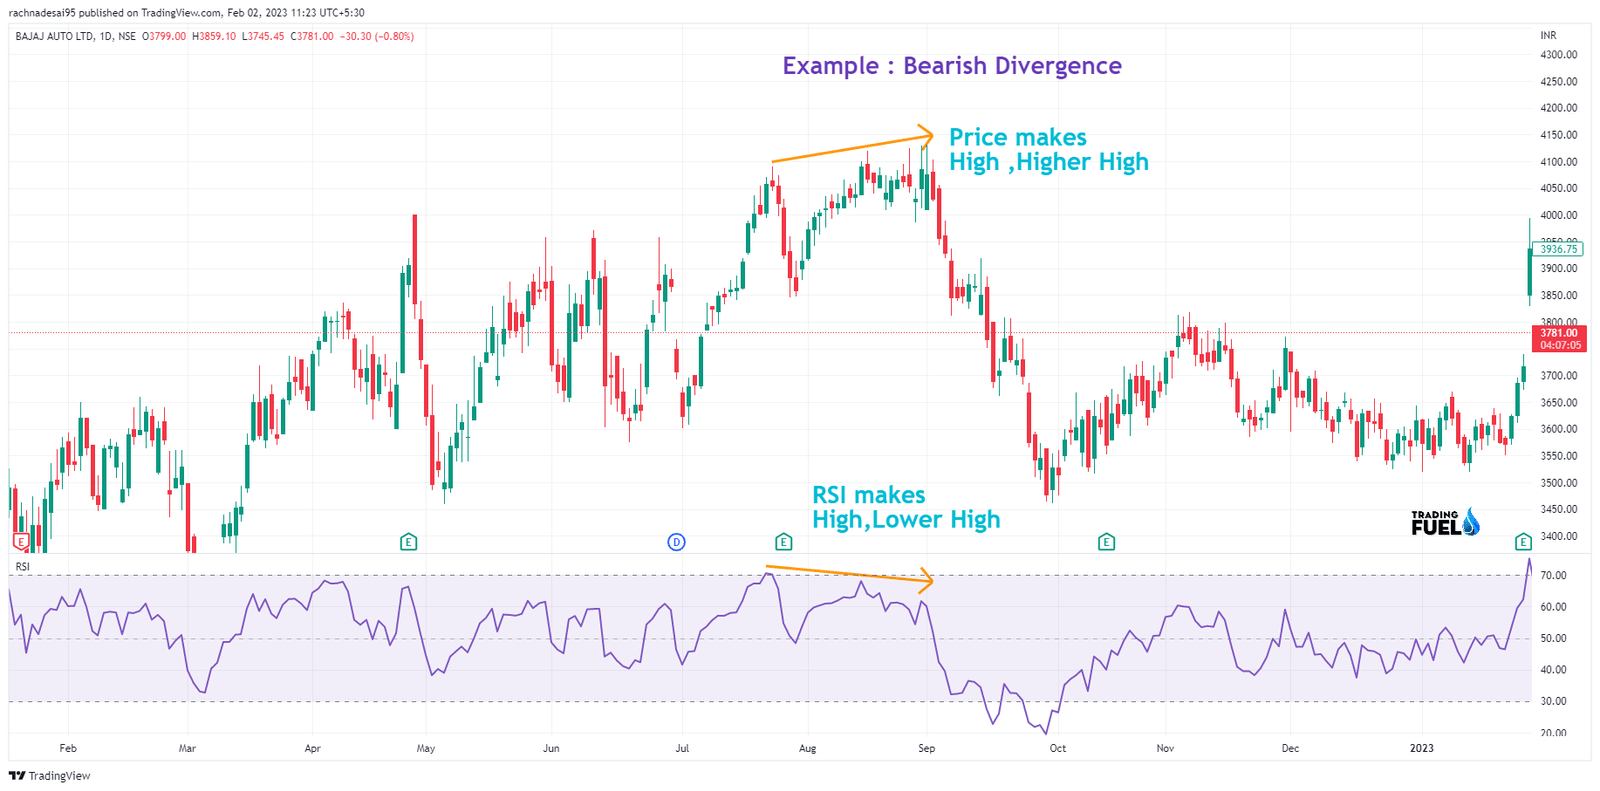
- On the other hand, a bearish divergence occurs when the RSI is making lower highs, while the price of the stock is making higher highs. This divergence suggests that the underlying momentum is bearish and that the price of the stock could start to move downside.
- For example, if a stock’s price is making new highs but the RSI is not, it could indicate a potential trend reversal. This divergence can provide early warning signals for traders to take action.
- Another important aspect of RSI is its ability to identify trend changes. If the RSI breaks above or below key levels, such as 30 or 70, it could signal a change in trend.
- This information can be useful for traders who use trend-following strategies, as they can adjust their positions accordingly.
Also read: What Is a Stochastic Indicator?
NOTE: RSI also provides false signals, especially in choppy market conditions. To mitigate this risk, traders can use other technical analysis tools, such as support and resistance levels, moving averages, and trend lines, to confirm signals from the RSI.
Download RSI Indicator for Amibroker (AFL)
// Downloaded From https://www.TradingFuel.com
_SECTION_BEGIN("RSI");
SetChartOptions(0,0,ChartGrid30|ChartGrid70,0,100);
periods = Param( "Periods", 14, 1, 200, 1 );
z = RSI( periods);

RSILineColor = ParamColor("RSI Line Color",ColorRGB(127,0,83));
RSIOverboughtColor = ParamColor("RSI Overbought Color",ColorRGB(127,0,83));
RSIOversoldColor = ParamColor("RSI Oversold Color",colorRed);


Plot( z, _DEFAULT_NAME(), RSILineColor , styleLine  );
Plot( 50, _DEFAULT_NAME(), RSILineColor , styleDashed|styleNoTitle  );
Plot( 70, _DEFAULT_NAME(), RSILineColor , styleLine|styleNoTitle  );
Plot( 30, _DEFAULT_NAME(), RSILineColor , styleLine|styleNoTitle  );
PlotOHLC(z,z,50,z,"",IIf(z>50,RSIOverboughtColor,RSIOversoldColor),styleCloud|styleClipMinMax,30,70);


_SECTION_END();
Conclusion:
In summary, the RSI is a versatile and widely used technical analysis indicator that can provide traders with valuable information about a stock’s price action. It is a valuable tool for identifying overbought and oversold conditions, divergences, and trend changes, but should not be used as the sole indicator for investment decisions. Traders should always consider multiple technical and fundamental factors when making investment decisions. We hope that you like our blog “What is RSI in Stock Market?”
Contain & Image ©️ Copyright By, Trading Fuel || Research Lab