
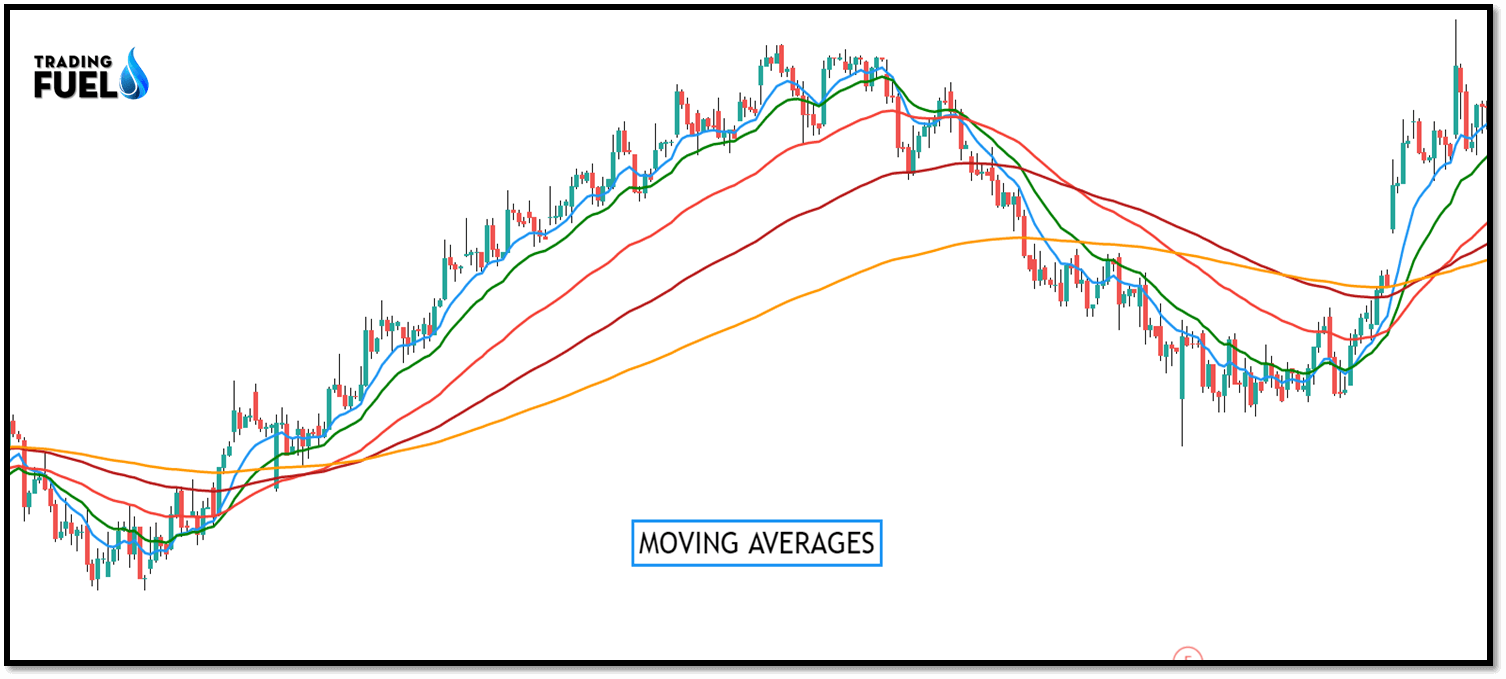
Moving Averages Trading Strategy: Moving averages are used by traders as a technical tool for analyzing future price moves.
Moving averages smoothen the price fluctuations, making it easier for a trader to analyze trends with the naked eye.
Moving averages is used in conjunction with other technical indicators like an oscillator, volume, RSI, MACD, etc. also with other averages.
A moving average is a technical indicator which shows the average value of a price over a specified period
Simple moving averages give equal weight to the past prices action.
Exponential and weighted averages give more weight to recent prices action.
Triangular averages give more weight to prices in the middle of the period.
Trading With Single Moving Averages Trading Strategy:
The most popular method of interpreting a moving average is to compare the relationship between moving averages and price.
A buy signal is triggered when the price crosses and close above its moving average, and a sell signal is triggered when the price close and close below its moving average.
This type of moving average trading system isn’t intended to give you entry at the bottom neither at the precise top.
It is designed to keep you in line with the trend by buying shortly after the price bottoms and selling shortly after it stops.
The moving average is often wont to identify buying and selling opportunities with its merit.
A trading system is often defined as a group of rules that assist you to identify entry and exit points.
A good trading system gives us an early signal to enter a profitable trade and an early signal to exit out the losing trade.
For example, we can form a simple moving average trading system with the following setoff rules:
Rule 1- Buy when the current market price turns crosses above the 50 days EMA.
Rule 2– Exit the long position when the current price crosses below the 50 days EMA
The line on the price chart is the exponential moving average.

Moving averages works well when there is a trend and fails to perform when the stock moves sideways.
This means the Moving average in its simplest form is a trend following system.
Few important characteristics of the Moving average:
- Moving averages gives you many trading signals during a sideways market.
- It would be very difficult to separately identify the big winner from the many small trades
- Hence the trader shouldn’t be selective in terms of choosing signals that moving average system suggests.
- the losses are minimized during a moving average system, but that 1 big trade is sweet enough to compensate all the losses and may offer you sufficient profits
- The key to moving the average trading system is to trade all the signals and not be selective about the signals.
Trading With Two Moving Averages Trading Strategy:
The problem with the plain moving average system is that it generates far too many trading signals during a sideways market.

A moving average crossover system is an upgraded version of the plain moving average system. It guides the trader to take high probability and prevent false trade setup in a sideways market.
In a MA crossover system, rather than the standard single moving average, the trader combines two moving averages.
A typical example of this can be to mix a 50 day EMA, with a 100 day EMA. The shorter moving average is also referred to as the faster-moving average. The longer moving average is referred to as the slower moving average.
The shorter moving average takes a lesser number of knowledge points to calculate the typical. A longer moving average takes more knowledge points to calculate the typical.
As you can see in the chart, the 50 day EMA line is closer to the current market price when compared to the 100 days MA.
We have made changes to the plain moving averages system with the crossover system to limit the number of entry and exit signals.
After this, the trader will get far fewer signals, but they have high chances of profitable trade.
The entry and exit rules for the crossover system are below:
Rule 1 – Buy when the short-term moving average crosses the long-term moving average.
Rule 2 – Exit the long position when the short-term moving average crosses a longer-term moving average.
Let us apply the MA crossover system to the chart below. We simplicity we have chosen only 20 and 50 MA crossovers.
The chart is shown below in the practical application of a MA crossover system with 50 and 100 days MA.

The line plots the 50-day moving average and the pink line plots the 100-day moving average.
The signal to go long generates when the 50-day moving average crosses over the 100-day moving average.
The crossover system keeps the trader away in the sideways market from the losing trades. This is the biggest advantage of using a cross-over system over the single moving average crossover.
A trader can use several combinations to create a MA cross-over system. Some of the popular combinations are:
- 9 day MA with 21 days MA
- 50 day MA with 100 Day MA
- 100 day MA with 200 days MA
Longer the time frame the lesser the noise generated by trading signals.
Trading rules for using a double crossover system are as follows:
Whenever the shorter-term moving average crosses above the longer-term moving average a buy signal it gives a buy signal.
Whenever the shorter-term average falls beneath the longer-term average sell signal it gives a sell signal.
Using Moving Averages Trading Strategy with RSI:
It is a momentum indicator that oscillates between zero and 100, indicating the speed and change in price.

RSI is widely used as an overbought/oversold indicator in the trader’s community.
RSI oscillates in-between values varying from 0 and 100. Any RSI above 70 is generally considered overbought and RSI below 30 is considered oversold.
In an uptrend or bull market, the RSI tends to remain within the 40 to 90 range, where the 40-50 RSI zones will act as support to price.
During a downtrend or bear market, the RSI tends to remain within the 10 to 60 range, where the 50-60 RSI zones will act as resistance to price.
Trading Rules
Rules for a Long Trade
- 50 periods SMA crosses above 100 periods SMA.
- RSI is greater than 50.
Rules for a Short Trade
- 50 periods SMA crosses below 100 periods SMA.
- RSI is less than 50.
Using Moving Averages Trading Strategy with MACD:
The Moving Average Convergence Divergence (MACD) is a technical indicator that simply measures the relationship of EMA.
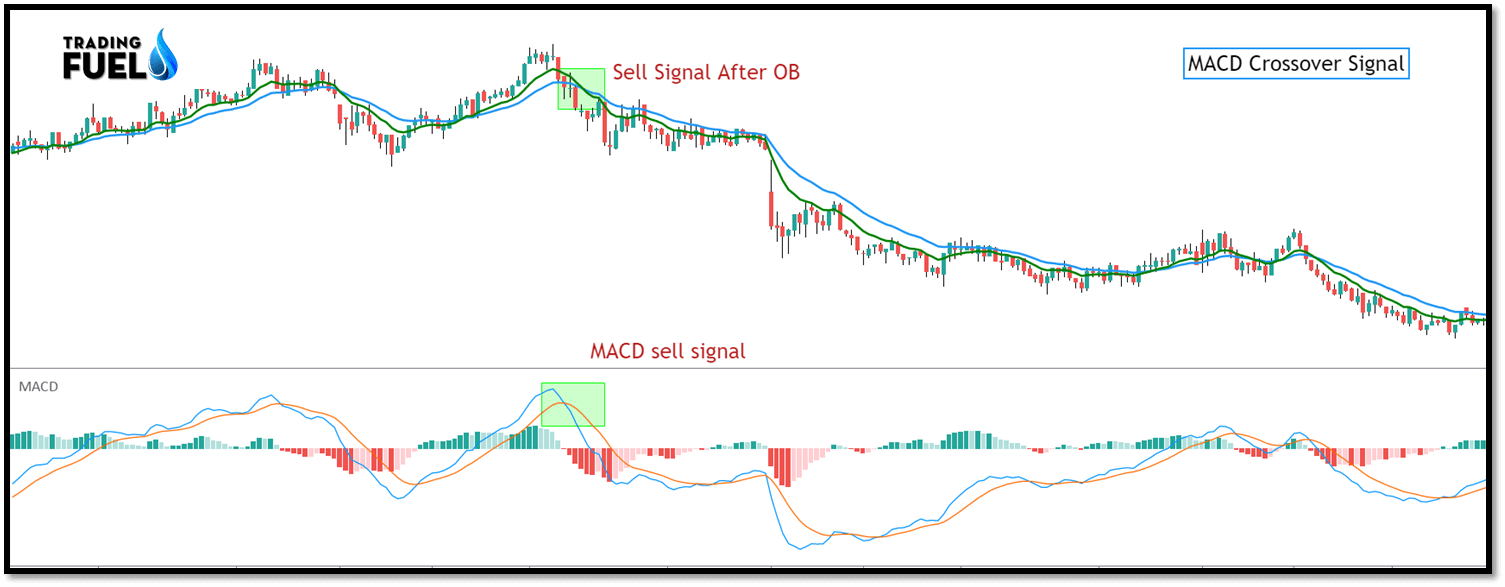
The MACD line is a difference between two exponential moving averages which is 12 and 26- periods MA, the signal line is generally a 9-period exponentially average of the MACD line.
These MACD lines oscillate around the zero lines. This gives the MACD the characteristics of an oscillator giving overbought and oversold signals above and below the zero-line respectively.
The MACD measures momentum or trend strength by using the MACD line and zero lines as reference points:
- When the MACD line crosses above the zero lines from below, this signals price is in an uptrend.
- When the MACD line crosses below the zero lines from above, this signals price is in a downtrend.
Rules for a Long Trade
- Wait for the price to trade above both the 50 SMA and 100 SMA.
- Once the price has broken above the closest SMA by 10 points or more, enter long if MACD has crossed to positive.
Rules for a Short Trade
- Wait for the price to trade below both the 50 SMA and 100 SMA.
- Once the price has broken below the closest SMA by 10 points or more, enter short if MACD has crossed to negative.
Conclusion:
In this blog, we have covered various aspects of a trading system based on a moving average relation with the price and the relationship of the different moving areas with each other. And we have seen how to use the moving average in conjunction with another technical indicator for double confirmation of our entry and exit price level. And to avoid a false trading setup that mostly occurs in a sideways market. Other than the technical aspect t of trading one must give equal emphasis to risk management and money management.
Contain & Image ©️ Copyright By, Trading Fuel Research Lab