Did you Know What is the CCI? The Commodity Channel Index (CCI) is an oscillator developed by Donald Lambert in the late 1970s. It is designed to help traders identify overbought and oversold levels in the price of an asset.
The CCI is calculated by taking the difference between the current price and the average price over a specified period of time, and then dividing that difference by the mean absolute deviation of the price over the same period.
The resulting value of the CCI is plotted as an oscillator that fluctuates above and below a central line, typically at the 0 level, and can have values ranging from +100 to -100. The CCI is used to identify potential trend reversals or divergences in price movement, as well as overbought or oversold conditions.
The Commodity Channel Index (CCI) is calculated using the following steps:
- Choose a time period: The first step is to choose a time period, which is typically 20 periods. This means that the CCI will be calculated based on the last 20 bars or periods of price data.
- Calculate the Typical Price: The typical price is the average of the high, low, and closing prices of an asset for a given period. To calculate the typical price, add the high, low, and closing prices together and divide the result by 3.
- Calculate the Simple Moving Average (SMA): The next step is to calculate the simple moving average (SMA) of the typical prices over the chosen time period. To calculate the SMA, add up the typical prices over the chosen period and divide the result by the number of periods.
- Calculate the Mean Deviation: The mean deviation is the average of the absolute deviations of the typical prices from the SMA over the chosen period. To calculate the mean deviation, subtract each typical price from the SMA, take the absolute value of the result, add up the absolute values, and divide the result by the number of periods.
- Calculate the Commodity Channel Index (CCI): The final step is to calculate the CCI by subtracting the SMA from the typical price and dividing the result by the mean deviation multiplied by a constant factor (typically 0.015).
- The formula for calculation of CCI:
CCI = (Typical Price – SMA) / (0.015 x Mean Deviation)
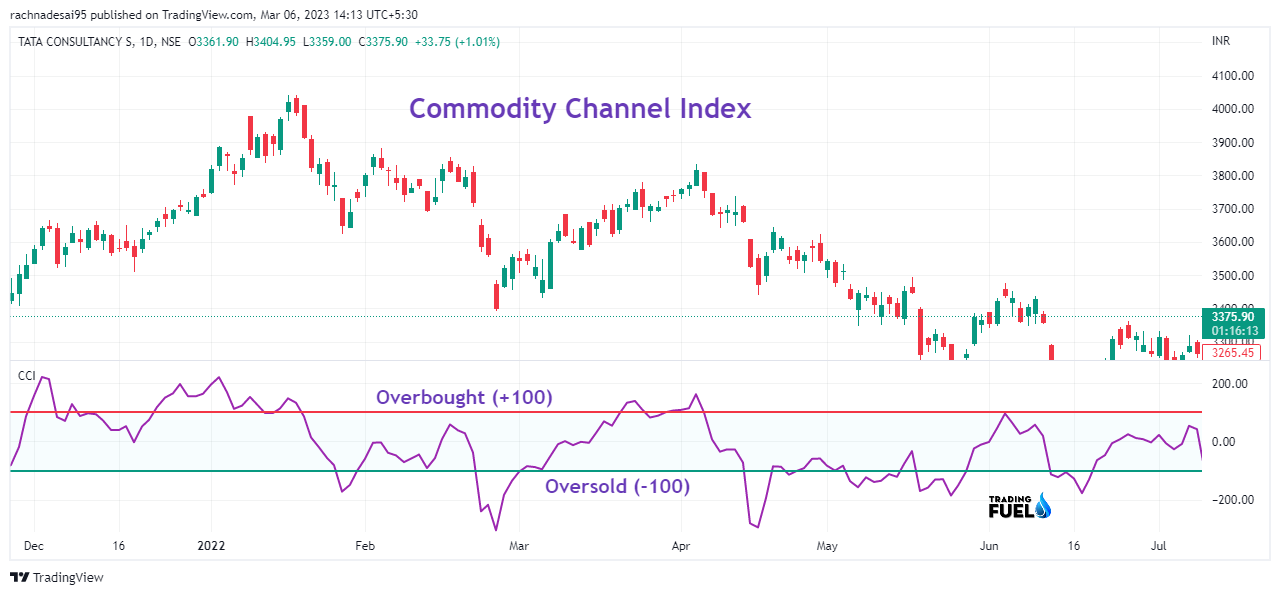
The resulting value of the CCI is plotted on a chart as an oscillator that fluctuates above and below a central line, typically at the 0 level, and can have values ranging from +100 to -100. Traders use the CCI to identify potential trend reversals or divergences in price movement, as well as overbought or oversold conditions.
You also like: Top 10 Best Technical Indicators
How to Use CCI?
The Commodity Channel Index (CCI) is a versatile tool that can be used in a variety of ways to analyse price movement and identify potential trading opportunities. Here are some ways that traders commonly use the CCI:
- Identifying Overbought and Oversold Conditions: One of the most common uses of the CCI is to identify overbought and oversold conditions in the price of an asset. When the CCI is above +100, it is considered overbought, and when it is below -100, it is considered oversold. Traders may use these levels as signals to enter or exit a trade, depending on their strategy.
- Identifying Trend Reversals: The CCI can also be used to identify potential trend reversals in the price of an asset. When the CCI crosses above or below the 0 line, it may signal a potential change in trend. Traders may look for other confirming indicators or signals to confirm the reversal before entering a trade.
- Identifying Divergences: The CCI can also be used to identify divergences between the price of an asset and the CCI indicator. A bullish divergence occurs when the price of an asset is making lower lows, but the CCI is making higher lows. This may signal a potential reversal to the upside. A bearish divergence occurs when the price of an asset is making higher highs, but the CCI is making lower highs. This may signal a potential reversal to the downside.
- Combining with Other Indicators: The CCI can be used in combination with other technical analysis tools, such as moving averages, trendlines, or other oscillators, to confirm signals and make trading decisions.
Overall, the Commodity Channel Index is a useful tool for traders who want to analyze price movement and identify potential trading opportunities. It is important to remember that no indicator is perfect and that traders should use multiple indicators and strategies to make informed trading decisions.
Download Commodity Channel Index (CCI) For Amibroker (AFL)
// Downloaded From https://www.TradingFuel.com
SetChartBkColor(ParamColor("backround color ",colorBlack));

_SECTION_BEGIN("CCI NEW");
periods = Param( "Periods", 20, 2, 200, 1 );
em = Param("EMA Of CCI",1,1,20,1);
p = EMA(CCI(periods),em);
Colore =IIf( p > 0 AND p  >= Ref(p ,-1),colorBrightGreen ,IIf( p > 0 AND p  < Ref(p ,-1),colorDarkGreen, IIf(p <0 AND p  <= Ref(p ,-1), colorRed,colorLightOrange)));
Plot( p , _DEFAULT_NAME(), Colore, ParamStyle("Style")  );
_SECTION_END();

_SECTION_BEGIN("CCI divergence");
//================cci divergence
ST33= CCI(30);
bars=50;
TR1= LLVBars(ST33,5);
COND1=TR1> 0 AND Ref(TR1,-1)==0 AND Ref(ST33,-1)<0;
TR2= IIf(COND1,Ref(ST33,-1),0);
M1= ValueWhen(COND1,ST33);
P1= ValueWhen(COND1,LLV(L,3));
DM1=M1- Ref(M1,-1);DP1=P1-Ref(P1,-1);
DT= Ref(BarsSince(COND1),-1);
POSDIV2=DM1> 0 AND DP1<0 AND DT<BARS;
TR11= HHVBars(ST33,5);
COND11=TR11> 0 AND Ref(TR11,-1)==0 AND Ref(ST33,-1)>0;
TR21= IIf(COND11,Ref(ST33,-1),0);
M11= ValueWhen(COND11,ST33);
P11= ValueWhen(COND11,HHV(H,3));
DM11=M11- Ref(M11,-1);DP11=P11-Ref(P11,-1);
DT1= Ref(BarsSince(COND11),-1);
NEGDIV2=DM11< 0 AND DP11>0 AND DT1<BARS;
PlotShapes(shapeSmallCircle*POSDIV2,colorBlue);
PlotShapes(shapeSmallCircle*NEGDIV2,colorOrange);
_SECTION_END();

_SECTION_BEGIN("CCI ribbons");
periods = Param( "Periods", 14, 2, 200, 1 );
em = Param("EMA Of CCI",5,1,20,1);
p = EMA(CCI(periods),em);
Colore =IIf( p > 0 AND p  >= 100,colorBrightGreen ,IIf( p > 0 AND p  < 50,colorGreen,IIf(p <0 AND p  > -50, colorPink,IIf( p > 0 AND p  < 100,colorDarkGreen, IIf(p <0 AND p  <= -100, colorRed,colorDarkRed)))));
Plot(6, " ", Colore, styleOwnScale|styleArea|styleNoLabel, -0.5,200);
_SECTION_END();

Plot(200,"",colorBlue,styleLine);
Plot(-200,"",colorBlue,styleLine);
Plot(0,"",colorSkyblue,styleLine);
PlotGrid(100, colorWhite);
PlotGrid(-100, colorWhite);
PlotGrid(-50,colorBrightGreen);
PlotGrid(50,colorRed);
Contain & Image ©️ Copyright By, Trading Fuel || Research Lab