Hidden Divergence RSI – Trading Fuel
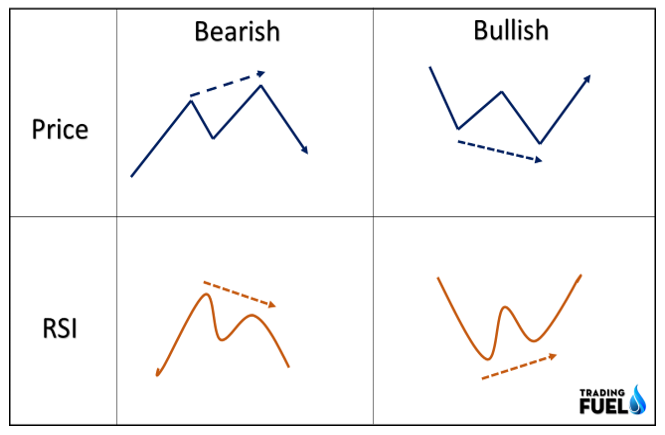
What Is Divergence?
In technical analysis, divergence refers to a difference between the direction of price movement and the direction indicated by an oscillator, such as a moving average or momentum indicator.
A bullish divergence occurs when the price of an asset makes lower lows. At the same time, the oscillator makes higher lows, indicating that momentum is increasing and a possible price reversal is coming.
A bearish divergence is the opposite and occurs when the price makes higher highs while the oscillator makes lower highs, suggesting a possible price decline. Divergence is used as a potential trading signal to indicate a change in trend.
The image below shows the Regular Divergence.
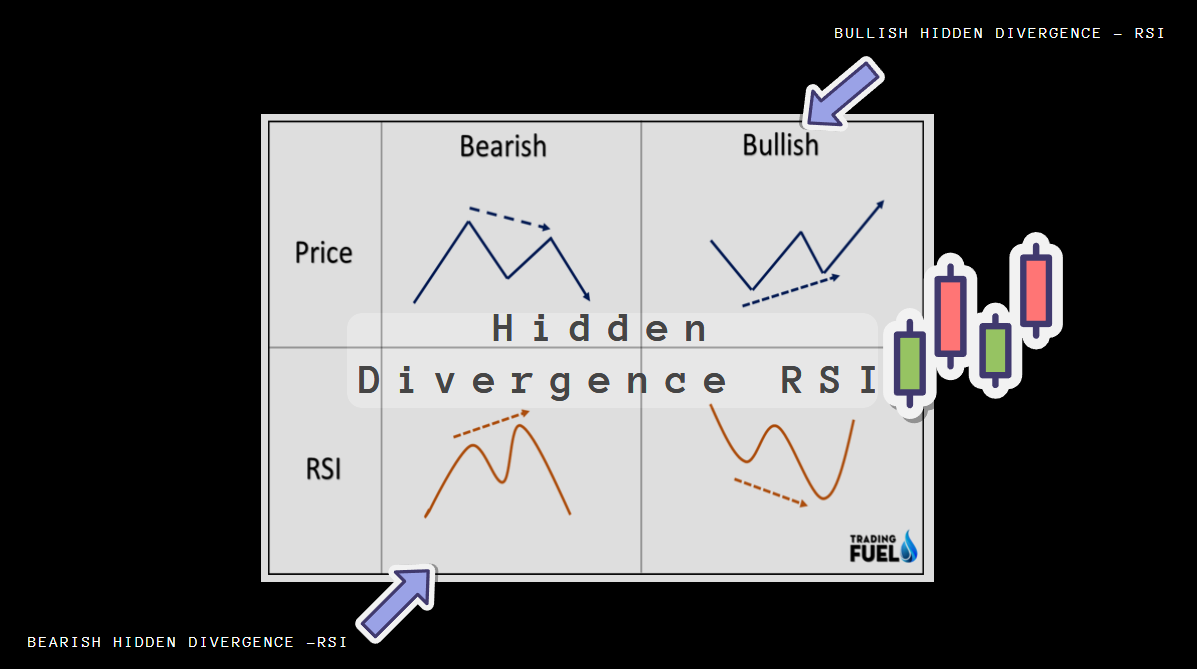
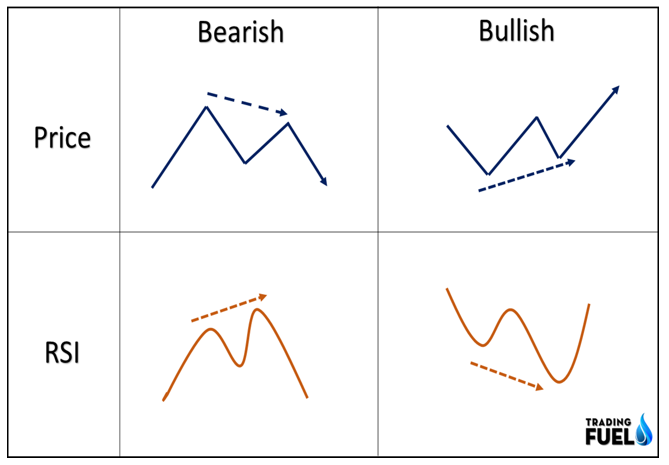
What Is Hidden Divergence?
Hidden divergence is formed when the price makes a higher low while the indicator creates a lower low. A hidden divergence can also divide into a bullish or bearish hidden divergence. The image below shows how hidden divergence occurs.
BULLISH HIDDEN DIVERGENCE – RSI
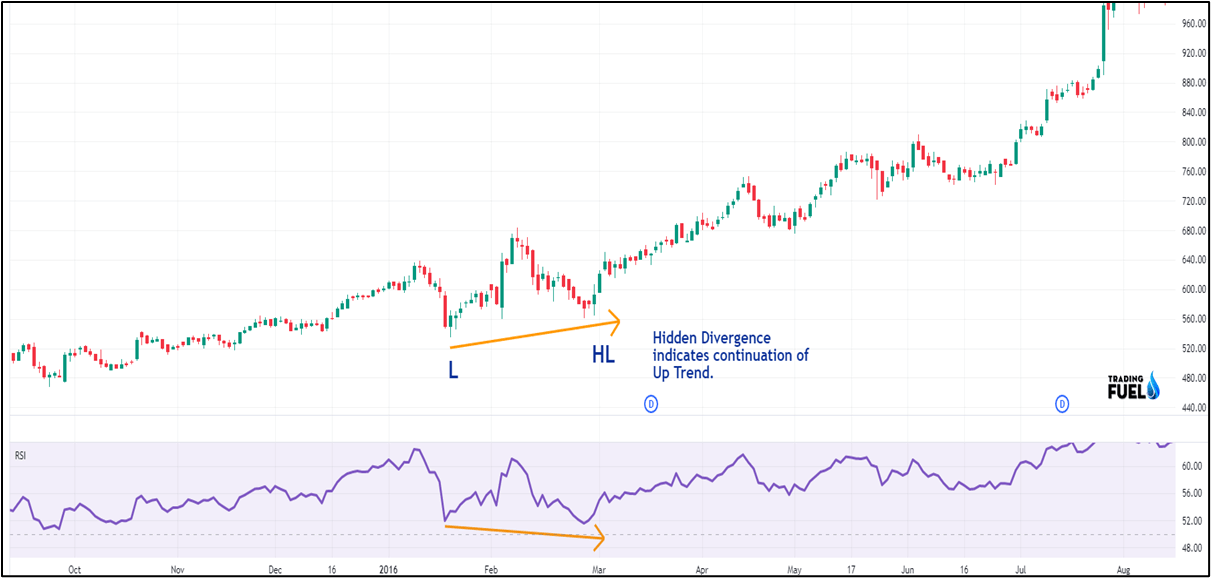
Bullish hidden divergence occurs in an uptrend correction where the price forms a higher low, but the RSI forms a lower low. It suggests a continuation of the bullish trend and indicates traders to keep a long position with trailing stop-loss.
Example:
You also like: How to Use the MACD Indicator? – Complete Guide
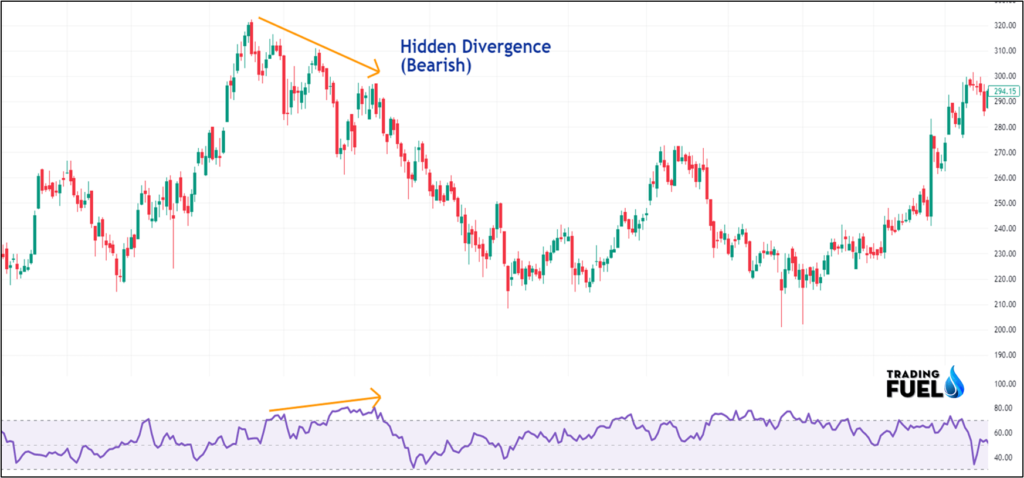
BEARISH HIDDEN DIVERGENCE -RSI
Opposite to bullish hidden divergence is bearish hidden divergence, where the price makes a lower high, but the RSI shows a higher high. This indicates a trend reversal, and traders should exit or put a stop loss.
Example:
When to Use Regular or Hidden Divergence
The distinction between regular and hidden divergence is delicate. Regular divergence signals the start of a corrective phase and is often identified after a prolonged trend.
Hidden divergence, on the other hand, indicates the end of a consolidation phase and the resumption of the initial trend direction.
In summary, regular divergence occurs at the end of a trend, while hidden divergence is seen at the end of a consolidation period.
How Is Hidden Divergence Different?
“Hidden divergence is different from regular divergence as it occurs within a continuation of the trend instead of at the end of the trend for a reversal pattern. It signals the end of a temporary pause within a larger trend, hence its name “hidden” as it is not easily noticeable.”
As you can see in the below image, hidden divergence occurred in the continuation trend, an at the end of the trend, the normal divergence took place.
You also read: Best Swing Trading Strategies | Part – 2
Benefits of hidden divergence:
- Early trend detection: Hidden divergence can help traders identify trend changes early, potentially allowing for more favorable entry and exit points.
- Confirmation of trend: Hidden divergence can serve as confirmation of a trend, adding to the reliability of a trade signal.
- Increased accuracy: By combining hidden divergence with other technical analysis tools, traders can increase the accuracy of their trade signals.
- Useful in different markets: Hidden divergence can be applied to various market types, including stocks, currencies, and commodities.
Hidden divergence has some limitations, including:
- Ambiguous signals: Hidden divergence can produce conflicting signals, making determining the true market direction difficult.
- Reversal not guaranteed: Hidden divergence does not guarantee a trend reversal and can sometimes lead to false signals.
- Limited in range-bound markets: Hidden divergence is less effective in range-bound markets where the price moves sideways.
- Requires experienced interpretation: Hidden divergence requires experienced interpretation and technical analysis skills to identify and properly utilize.
- Can be a late signal: Hidden divergence can occur later in the trend, potentially causing missed trading opportunities.
Download RSI For Amibroker (AFL)
// Downloaded From https://www.tradingfuel.com
_SECTION_BEGIN("RSI");
SetChartOptions(0,0,ChartGrid30|ChartGrid70,0,100);
periods = Param( "Periods", 14, 1, 200, 1 );
z = RSI( periods);

RSILineColor = ParamColor("RSI Line Color",ColorRGB(127,0,83));
RSIOverboughtColor = ParamColor("RSI Overbought Color",ColorRGB(127,0,83));
RSIOversoldColor = ParamColor("RSI Oversold Color",colorRed);


Plot( z, _DEFAULT_NAME(), RSILineColor , styleLine  );
Plot( 50, _DEFAULT_NAME(), RSILineColor , styleDashed|styleNoTitle  );
Plot( 70, _DEFAULT_NAME(), RSILineColor , styleLine|styleNoTitle  );
Plot( 30, _DEFAULT_NAME(), RSILineColor , styleLine|styleNoTitle  );
PlotOHLC(z,z,50,z,"",IIf(z>50,RSIOverboughtColor,RSIOversoldColor),styleCloud|styleClipMinMax,30,70);


_SECTION_END();
Conclusion:
Hidden bullish and bearish divergences are strong indicators seen at the end of market consolidation. These patterns suggest continuing the prevailing trend commonly found in crypto markets such as Bitcoin and Ethereum, thus making them simple to identify.
Identifying hidden divergences in real time can prove difficult. Late discovery of these patterns results in less lucrative trades.
Maximizing profits with hidden divergence trading requires filtering trades according to the dominant trend and examining market sentiment. Confirming signals with a trend-following momentum indicator is also advisable.
Contain & Image ©️ Copyright By, Trading Fuel || Research Lab