Technical analysis is a very broad term that can be used to examine the market data to try and predict the future price trends. The most important strategy used for technical analysis is the use of technical indicators.
What are technical indicators?
- Technical indicators are the mathematical calculations or can sometimes be as simple as a trend line that will allow traders to identify when the stock is experiencing an overbought or oversold condition.
- They use historic prices, open interest information, and volume to forecast in which direction the financial asset is going.
- This knowledge will help a trader identify different trading opportunities.
How do the technical indicators work?
- Basically, technical indicators don’t work; rather, they are a measure of the psychology of the market.
- They will simply depict what the price has done in relation to the previous prices so that they can be used as guidelines for the traders.
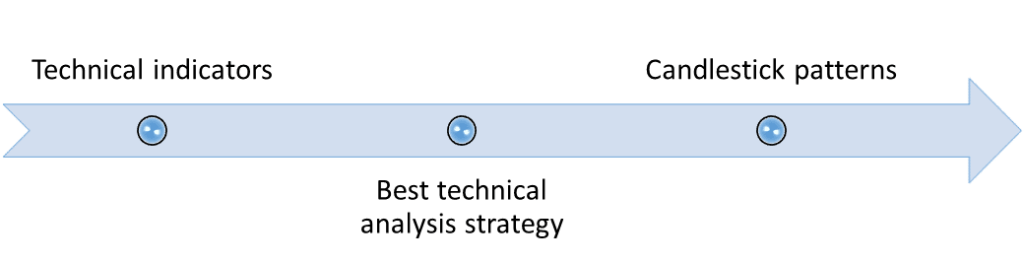
The best technical analysis strategy can be developed using the following two strategies:
What are the two basic types of technical indicators?
There are two basic types of technical indicators.
They are as follows:
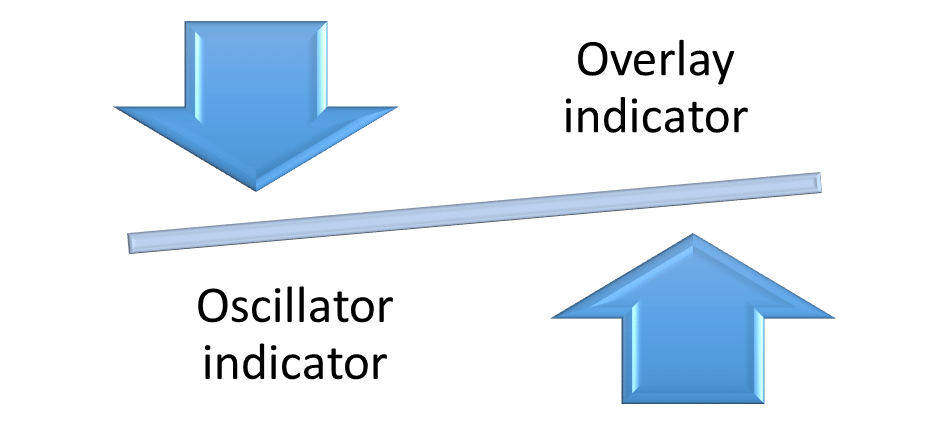
Overlay indicator:
- This is a basic trading as well as technical analysis technique that will involve overlaying one trend with another.
- In the case of an overlay on a chart, this will simply display two lines with two different colours on a chart so they can both remain visible.
Oscillator indicator:
- This indicator will measure the distance between two points on a simple technical analysis graph in order to track the momentum.
- The most common oscillator indicator is the moving average indicator.
- This will help the traders to determine when they should buy or sell a stock as well as make more accurate decisions about when the value of the assets will increase before the reverse trend starts.
Read more details: Indicator and Oscillator
There are two common oscillator indicators, such as:
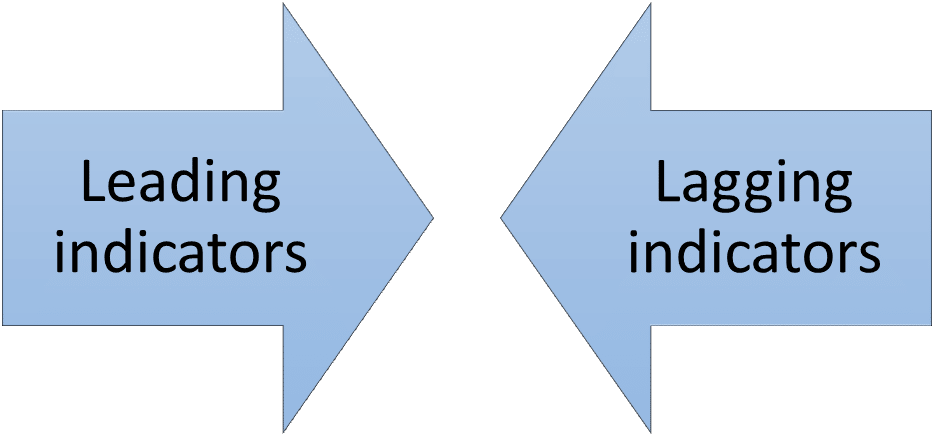
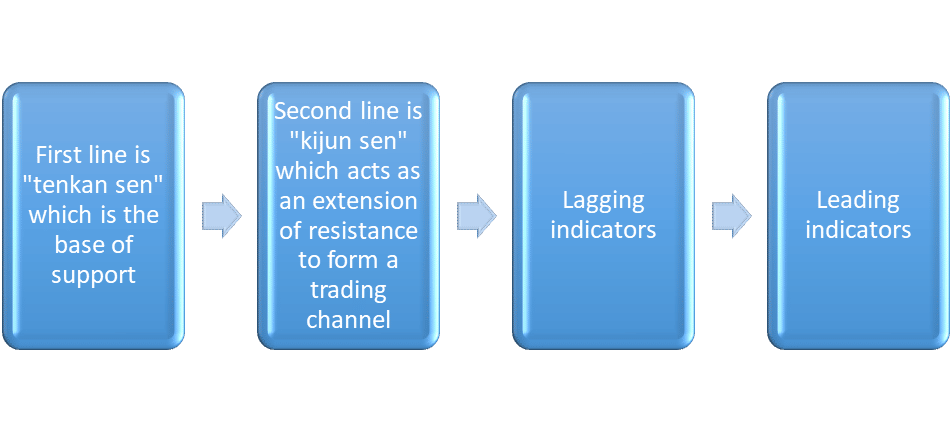
Leading indicators:
- They will tend to measure the current market condition so as to provide an indication of what is most likely to happen next.
- Generally, these indicators are used in conjunction with the lagging indicators.
Lagging indicators:
- These are the measurements based on recent history and include moving average (MA), moving average convergence divergence (MACD), and exponential moving average (EMA).
- When these two indicators are used together, they will give a more accurate reading of the market sentiment and will help to better predict the potential price movements.
Top 10 Technical Indicators
The following indicators are considered the best technical indicators:
| Sr. No. | Technical Indicator |
| 1 | Heikin Ashi |
| 2 | Relative Strength Index (RSI) |
| 3 | Parabolic SAR indicator |
| 4 | Bollinger Bands indicator |
| 5 | Standard Deviation indicator |
| 6 | Fibonacci Retracement indicator |
| 7 | Williams Percent range (%R) |
| 8 | Ichimoku Cloud indicator |
| 9 | Aroon oscillator |
| 10 | Commodity Channel Index (CCI) |
Heikin Ashi
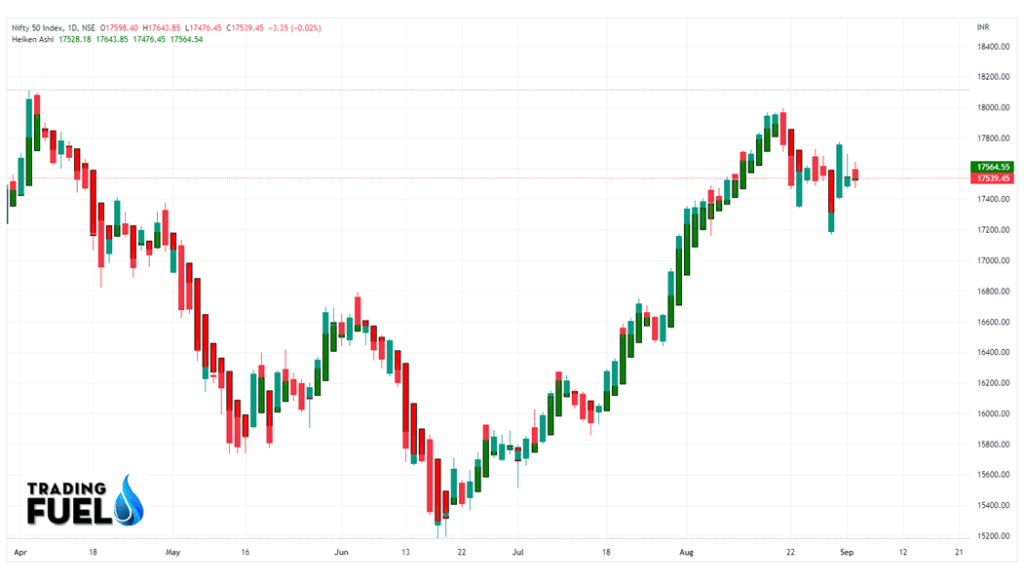
- Heikin Ashi (HA) is a type of price chart that uses averages to show the price movement of an asset.
- This chart will be used as a form of technical analysis to look at an asset price movement with regard to an overall trend.
- Just like all the other regular candlesticks, Heikin Ashi candles will be displaying four different price levels, such as the lowest point, the highest point, the open, and the close prices.
- But they will use data from both the current and previous sessions to derive their values.
- The HA formula is the method that is used to calculate each candlestick on the chart.
- Some of the formulas or calculations are more complicated than those used for a standard candlestick.
- Let us look at the simplified version of how to calculate the Heikin-Ashi candlesticks:
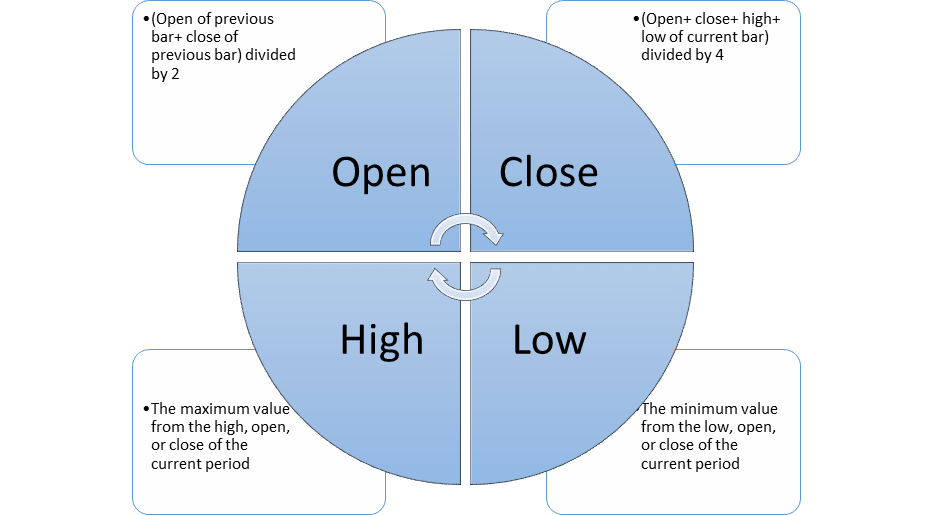
They are as follows:

The chart for the same is as below:
You can also check: Top 5 Bullish Indicators
Relative Strength Index (RSI)
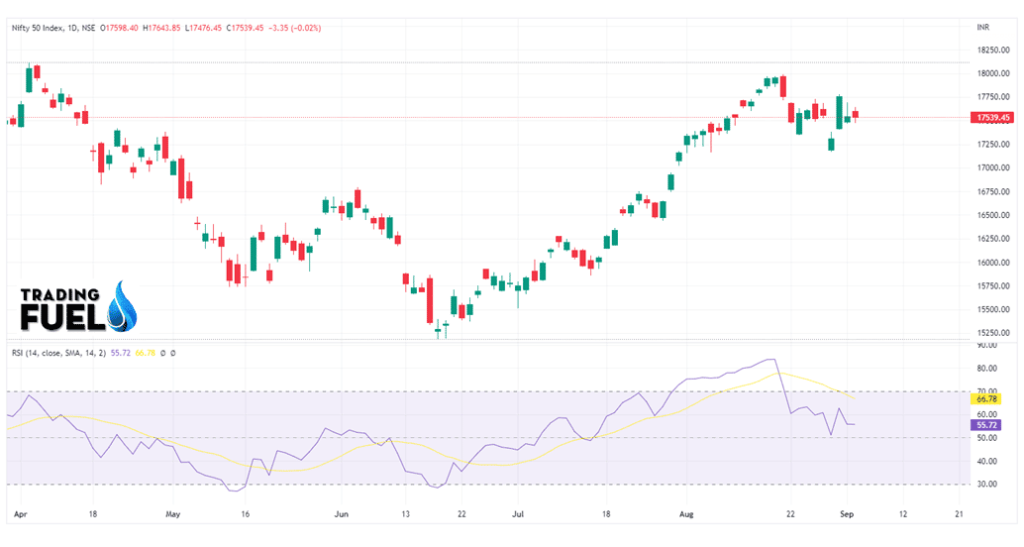
- The RSI is a technical momentum indicator that will compare the magnitude of recent gains and losses over time and will then plot them as an oscillator.
- This index was developed in 1978 and since then it has become the most popular oscillator indicator.
- RSI is basically expressed as a figure between 0 and 100.
- In RSI, an asset around 70 levels is considered overbought, whereas an asset at or near 30 levels is considered oversold.
The chart for the same is as below:
Parabolic SAR Indicator (PSAR)
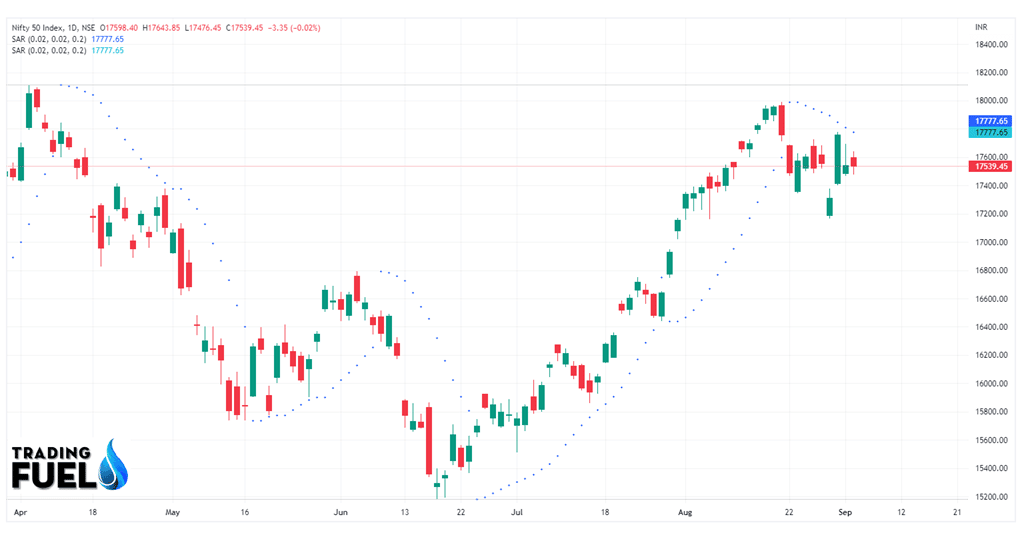
- The parabolic SAR is a very popular indicator that is used in technical analysis so as to determine the prices at which the momentum has changed.
- This indicator can be seen as an improvement to a traditional moving average crossover system because it has a more intuitive approach for determining the signal changes.
- PSAR buy/sell will occur when the current closing price crosses above or below the purchase price line.
- Instruments or stocks are bought when the same will break out from the prices that have been trading inside a trend channel.
A sell signal will occur when the instrument breaks through the support levels.
The chart for the same is as below:
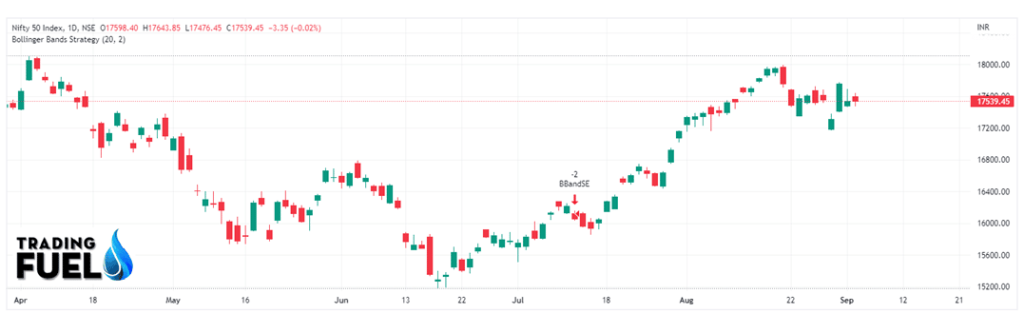
Bollinger Bands indicator
- This indicator can be visualised as the price envelopes that are also developed along the standard deviation up and down the average price.
- This indicator will use parameters such as period and standard deviation.
- For this indicator, 20 is the present value for each period, and 2 is for the standard deviation.
- These values can be changed as per your needs.
- In Bollinger Bands, when the bands are close enough, it will denote a period of low volatility where the price of the stock can turn sharply either way.
- When there is a large enough gap between the bands, then it will denote a period of high volatility and, most importantly, an ongoing trend that is coming to an end.
- Here, the price of the stocks will keep bouncing between the upper as well as the lower envelope.
- When the price bounces off from the lower envelope, then crosses the average, and then moves towards the upper envelope, then that particular point can be set as the profit target, and vice versa.
- This indicator will also allow the user to know if the stock is either overpriced or underpriced.
Read more details about Bollinger Bands Trading Strategy
The chart for the same is as below:
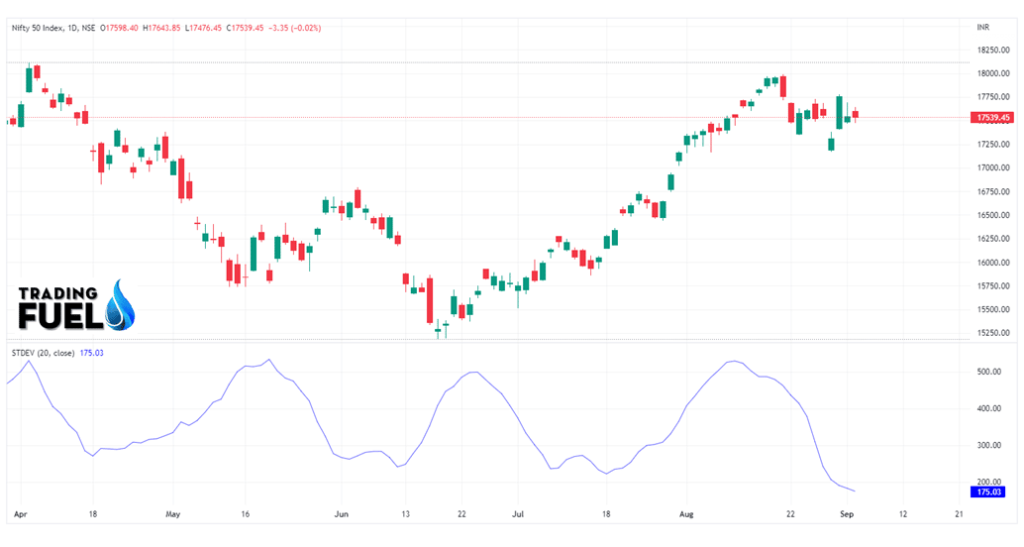
Standard Deviation indicator
- This indicator will help traders measure the size of the price moves.
- They can also identify how likely volatility is to affect the price in the future.
- The main drawback of this indicator is that it cannot predict whether the price will go up or down and that it can only be affected by volatility.
- The Standard Deviation indicator will compare the current price movements to historical price movements.
- Many of the traders will believe that the big price moves will follow the small price moves and vice versa.
The chart for the same is as below:
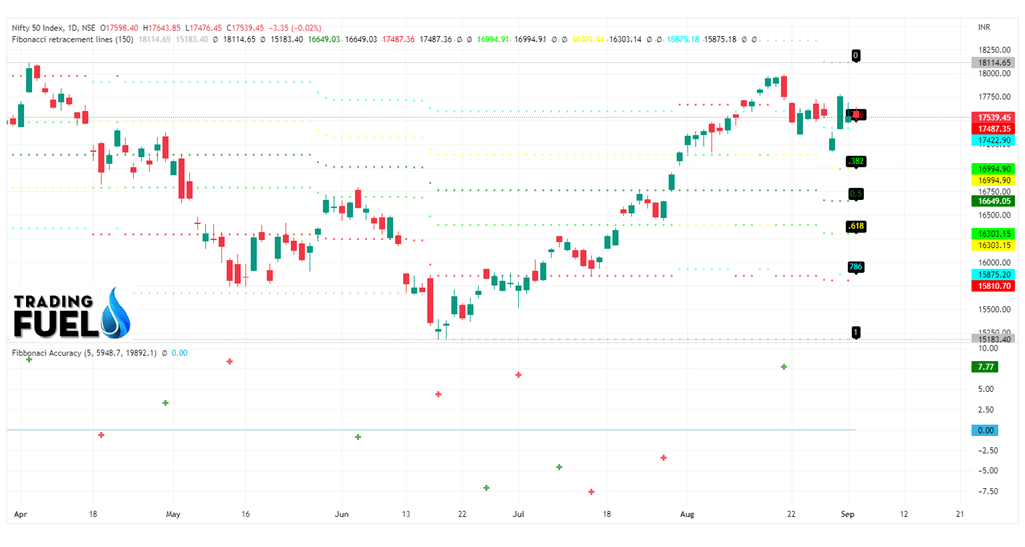
Fibonacci Retracement indicator
- This indicator will pinpoint the degree to which the market will move against the current trend.
- A retracement is nothing but it is the time when the market will be experiencing a temporary dip which is also known as pullback.
- Traders who are of the opinion that the market is about to make a move will often use Fibonacci retracement to confirm the same.
- This will also help us to identify possible levels of support as well as resistance, which will indicate an upward or a downward trend.
- This indicator will assist traders in determining the level of support or resistance, as well as where to place their stop loss and when to open or close their positions.
The chart for the same is as below:
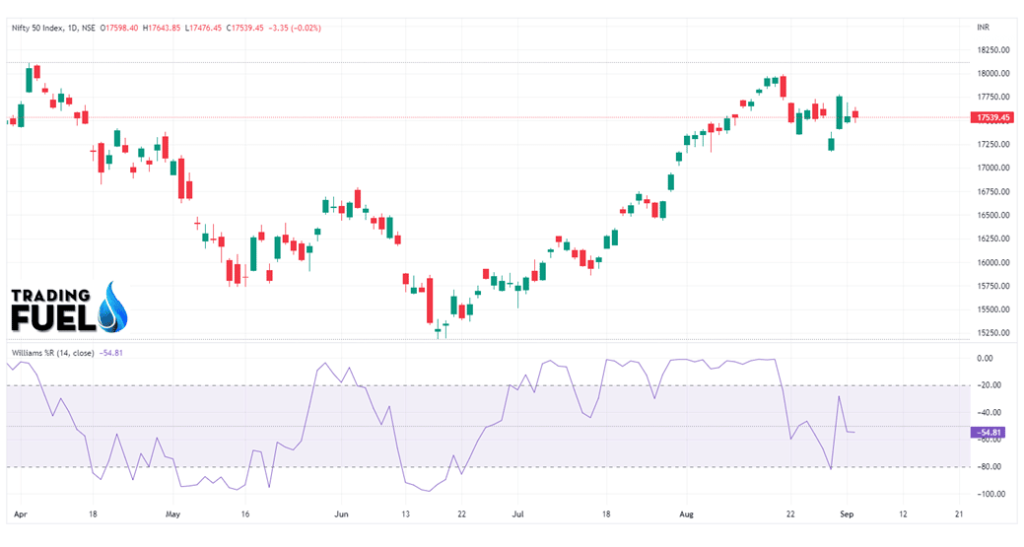
Williams Percent Range (%R)
- The Williams Percent Range (%R) indicator is a volatility indicator that will chart the magnitude of the recent price action.
- It is calculated by subtracting the low from the high and then eventually dividing it by two (the result is supposed to be between 0-100%).
- A significant reading will suggest an oversold or overbought condition that might signal a reversal in the trend direction on either side of zero.
- When we are using this indicator, traders wish to see the value above 70% as it will signal the trend towards the buy position.
- All the readings below 30% will represent conditions where the sell orders are likely to succeed.
The chart for the same is as below:
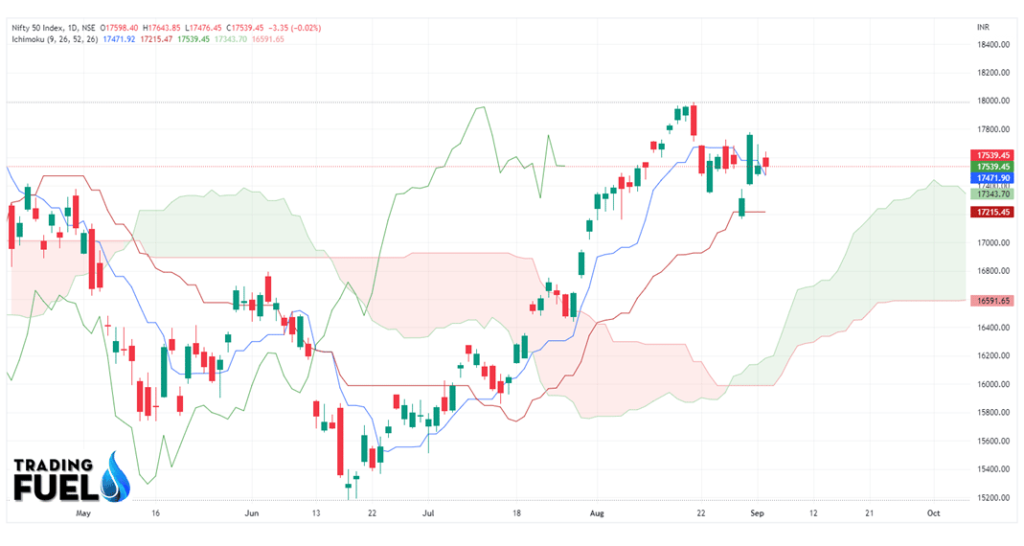
Ichimoku Cloud indicator
- The Ichimoku Cloud will, like many other technical indicators, identify support as well as resistance levels.
- This indicator will estimate the price momentum and, hence, will provide the traders with signals that will help them with their decision-making.
- The translation of “Ichimoku” is one look equilibrium chart, which is why this indicator is used by traders who need to have a lot of information from one single chart.
- In a nutshell, this indicator will identify the market trends after showing the current support and resistance levels and thereby forecast future levels.
This indicator is created using four lines as follows:
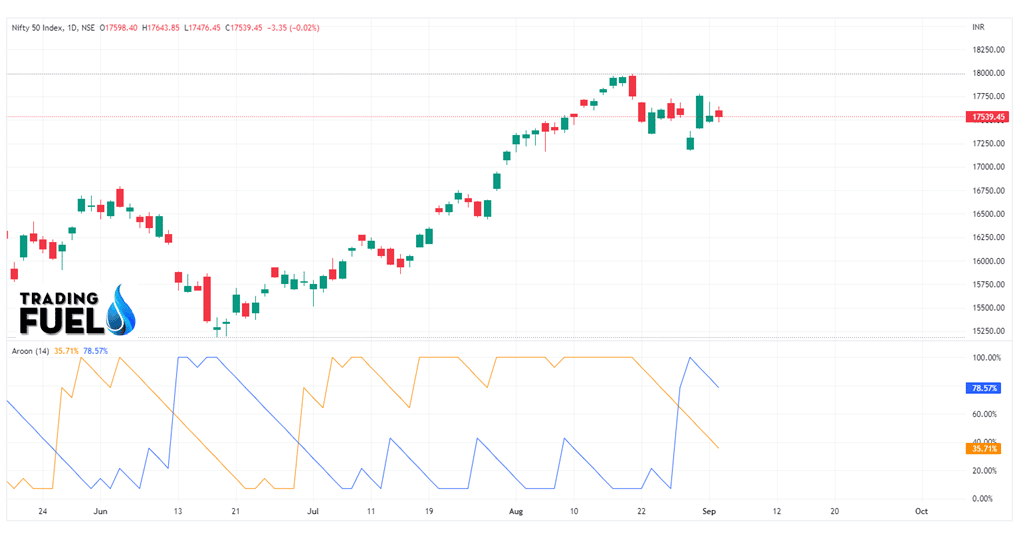
Aroon oscillator (AO)
There are in total two lines for this stock indicator:

- When the Aroon-up line touches 100 and the Aroon-down line is near 0 (zero) and stays in the same position for some time, you are likely to witness an uptrend.
- The reverse will hold for the downtrend.
- When the prices are rising, AO will also rise. When the prices are falling, AO will also fall.
- The main difference between these two lines will indicate whether the stock is overbought (a positive number) or oversold (a negative number).
The chart for the same is as below:
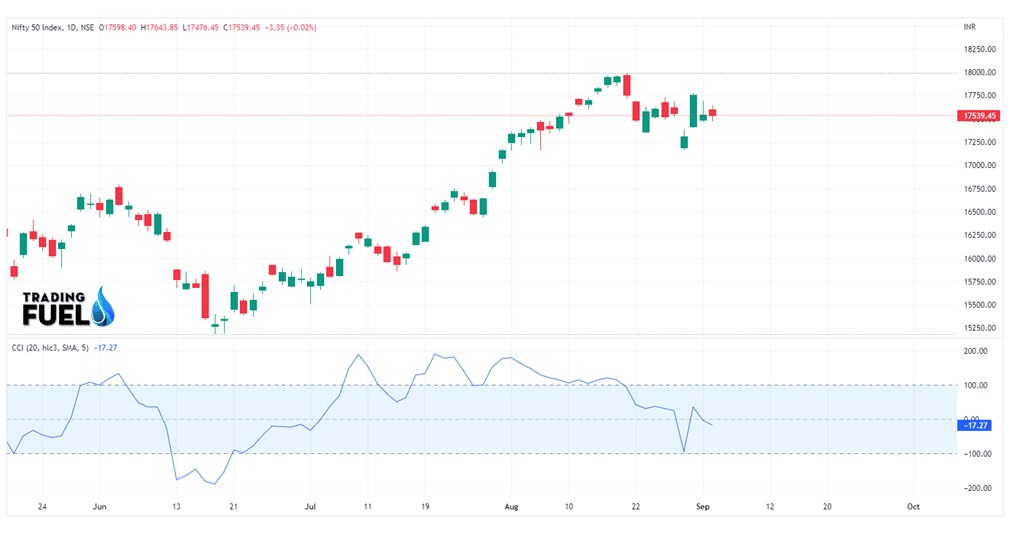
Commodity Channel Index (CCI)
- The CCI indicator makes use of the momentum basis to judge whether the stock is approaching the condition of being overbought or oversold.
- The CCI oscillator is a very useful tool for traders as it will not only tell them whether they should buy or sell any stock, but also indicate whether they should refrain from trading altogether.
- This indicator will work by calculating the difference between the current price of the stock as well as the historical average price.
- If the value for the same comes to zero, then the price is set to be above the historic average and, thereby, an upward trend can be expected.
- Here, CCI should be nearing 100 or even going above it.
- If the value for the same is below zero, then a downward trend has to be expected.
- Here, CCI should be nearing 100 or even going below it.
The chart for the same is as below:
Conclusion
The above is the list of the best technical indicators. You can choose anyone for your daily trade.
Frequently Asked Questions (FAQs)
Answer: The best stock market analysis tools are Bollinger Bands, Commodity Channel Index (CCI), RSI, Moving Average, etc.
Answer: RSI combined with MACD is widely used for options trading.
Answer: Technical indicators are useful for understanding past trends as well as anticipating future moves.
Answer: Moving Average Convergence Divergence (MACD) is the most profitable technical indicator.
Answer: They fail because nothing in trading is 100%. They will work once you take responsibility for your trading decisions.
About Us
Trading Fuel is our website for blogs where we give you knowledge about finance, the stock market, and technical analysis. Stay tuned with us for more such blogs.