
Most Effective Top 5 Bullish Indicators: The market is considered to be recovering from the COVID-19 phase.
Since then, there have only been bullish trends in the market.
What is a Bullish Trend?
Bullish trends will provide an investor with a platform where they can take a risk, and there are also very favorable odds for getting the value of the money due to the overall rise in the index.
It is important for investors to understand and predict these bullish cycles to the best of their advantage, and the technical indicators will equip them with all the quintessential tools to approach and conquer the adventurous world of the stock market.
What are the bullish indicators?
We are currently living in a world with the most sophisticated technology, with numerous calculations and probabilities.
This is considered the most accurate way to generate the output.
For investors, technical indicators will do the same thing and will also predict the trend as well as future stock prices.
With the help of the indicators, investors can know whether it is the time to BUY or SELL.
Most Effective Top 5 Bullish Indicators
As discussed above, we need indicators to trade.
The following are considered to be the top 5 bullish indicators in the market:

You Also Read:Best Swing Trading Strategies | Part – 2
#1. Bollinger Bands: Most Effective Bullish Indicators
The Bollinger band is a mixture of the moving averages, which consists of the 20-period moving average with the upper and lower bands.
It is considered the most effective and bullish technical indicator that helps in spotting breakouts in the trend, specifically in the case of sideways trends, where almost all the other popular indicators fail.
Bollinger bands also help in predicting the movement of prices and will also provide a clear entry point.
Here, the upper band is considered as the 2-standard deviation of the above-moving average, whereas the lower band is considered as the 2-standard deviation of the below-moving average.
Source of providing signal:
- The upper and lower bands will work as resistance as well as support, respectively.
- Whenever the price is in either band, movement in the opposite direction is expected.
- A breakout is expected when the price volatility falls and both the bands will contract or tighten.
Example:
Let us take the example of Reliance Industries:

From the above candlestick chart, we are looking at the stock prices of Reliance Industries.
Here, we have used Bollinger Bands with the standard settings of 20 and 2 with a day-1 candle.
We can see how the stock prices were trading sideways with lower volatility, which in turn indicated a signal of breakout.
We can then position ourselves to trade once the direction of the breakout is confirmed.
In the above chart, we can see that the breakout is confirmed when the stock prices break the necessary thresholds.
This indicator also provided us with the entry points to initiate the trade as well as cleared all the unnecessary signals.
Learn Now:Best Intraday Trading Indicators
#2. Ichimoku Cloud: Most Effective Bullish Indicators
The Ichimoku cloud is a bullish indicator that provides a trend following indicator and also predicts all the price movements.
This indicator is based on visualization as well as the conjunction of multiple indicators.
Here, we focus on the viability of the indicator and not on its technicalities.
But for that, first, we need to understand the components of this indicator.
The following are the main components of this indicator:

Read More:Ichimoku Cloud Definition and Uses
#1. Tankan Sen, or the Conversion Line:
This is the fast-moving average price-sensitive line.
It will measure the short-term price movement.
#2. Kiju Sen, or the Base Line:
This is the slow-moving average line.
It will measure the long-term or medium-term price movement.
#3. Senkou Span A and Senkou Span B:
This line works as support and resistance and will provide the confirmation of the signal.
These two lines will make up the Kumo cloud.
#4. Kumo Cloud:
This feature will filter out all the noise as well as provide all the trading entry points.
It is made up of two lines known as Span A and Span B.
They indicate dynamic support as well as resistance levels.
The longer the prices stay above or below the cloud, the stronger the trend is expected to be.
#4. Chikou Span:
This component will provide a second confirmation of the trend direction.
Here, if the current price is higher than in the past, then the trend is completely expected to be bullish in the upcoming sessions.
To clarify these indicators, let us look at the interpretation of each component:
Read More:Ichimoku Cloud Definition and Uses
#1. Conversion line and the baseline crossover:
Bullish signal: when the conversion line, i.e., blue, crosses the baseline, i.e., red from below, a bullish signal will be generated if the prices are above the Kumo cloud.
Bearish signal: when the conversion line, i.e., blue, crosses the baseline, i.e., red from above, a bearish signal will be generated if the prices are below the Kumo cloud.
#2. Chikou Span (lagging span):
Bullish signal: When the span is greater than the prices and they are moving upward, it indicates a bullish trend.
When the current prices are higher than the previous prices, this will indicate a positive movement in the prices.
Bearish signal: when the span is lower than the prices and they are heading in a downward direction, it signals a bearish signal.
Here, when the current prices are higher than the previous prices, this will indicate a negative movement in the prices.
#3. Kumo Cloud:
When the prices are trending inside the cloud, the prices are said to be in a sideways trend and one should avoid taking such a position.
When the prices are trending above the cloud prices, they are said to be in a bullish trend, and here the Senkou Span A crosses above the Senkou Span B, turning green.
When the prices are trending below the cloud prices, they are said to be in a bearish trend, and here the Senkou Span B crosses above the Senkou Span A, turning red.
The greater the distance between the Senkou Span A and B, the stronger the trend will be.
An example of this indicator is as below:

Here, we are looking at the chart of Reliance Industries.
In this chart, prices were initially in a descending trend, but when the conversion line crossed the baseline, it triggered the bullish signal.
When the prices went above the Kumo cloud, the chikou span showed an upward movement and hence provided secondary confirmation of the bullish signal.
#3. MACD Crossover: Most Effective Bullish Indicators
Moving average convergence divergence, or MACD will provide both trends following as well as momentum signals as it is a combination of the moving averages that will spiral around the zero line, making it suitable for both long-term and short-term trades.
MACD consists of three lines:

- MACD or the fast line: this line is calculated by subtracting the 26-period EMA from the 12-period EMA.
- Signal or slow line: this line is calculated by taking the 9-day EMA of the MACD or the fast line.
- Centre line or the zero line: this line is a straight line. The MACD and the signal line will revolve around these zero lines.
Source of providing signal:

The following are the sources that provide signals:
#1. Moving averages crossovers:
It is also known as the MACD crossover, and it occurs when the MACD (fast) line crosses the signal (slow) line.
A bullish signal will be generated when the MACD line crosses the signal line from below.
A bearish signal will be generated when the MACD line crosses the signal line from above.
Hence, MACD crossovers are generally considered a very common indicator, and hence we have to wait for the centerline crossovers.
#2. Centre line crossovers:
The center line crossover will happen when the MACD (fast) line crosses the zero (centerline).
A bullish signal will be generated when the MACD line crosses the zero line from below.
A bearish signal will be generated when the MACD crosses the zero line from above.
This line generates the most accurate signal in the long run.
#3. Divergences:
This indicator is not seen too frequently.
When they are seen, they are a great insight into future price movements.
When the prices are making higher highs and the buying pressure is falling, resulting in the lower highs, it is a negative divergence.
When the prices are making lower lows and the buying pressure is rising, resulting in the MACDs’ positive movement, it is a positive divergence.
An example of this indicator is as below:

Here we are looking at the chart of Reliance Industries.
In the above case, we can witness all the forms of the signal as the prices were initially trending sideways, which was then corrected when the MACD line crossed the signal (blue) line from below.
This indicated the MACD crossover.
The centerline crossover triggered the bullish reversal, which in turn led to a positive movement in the trend.
#4. EMA crossovers: Most Effective Bullish Indicators
The EMA is another form of the moving average.
It places greater weight on the recent data points, which makes the data more responsive to the new information.
When combined with other indicators, EMA can help traders confirm significant market moves and assess their legitimacy.
The most popular exponential moving averages (EMA) are the 12 and 26-day EMAs for the short-term, whereas the 50 and 200-day EMAs are for the long-term.
The example of the EMA crossover is as below:

Here, we are looking at the chart of Reliance Industries.
Whenever there is an EMA crossover, the movement of the prices is reversed from the previous prices.
Read More:
Read More: Moving Averages Trading Strategy
#5. RSI Weakness: Most Effective Bullish Indicators
The relative strength index, or RSI, primarily assists traders in identifying momentum, market conditions, and warning signals for dangerous price movements.
RSI is generally expressed as the figure between 0 and 100.
An asset that is around 70 levels is often considered overbought, while an asset that is near or at 30 levels is often considered over-sold.
An overbought signal will suggest that the short-term gains will be reaching a point of maturity and the assets may be in for a price correction.
Conversely, an oversold signal will suggest that the short-term declines are reaching their maturity and the assets may be in for a rally.
An example of this indicator is as below:
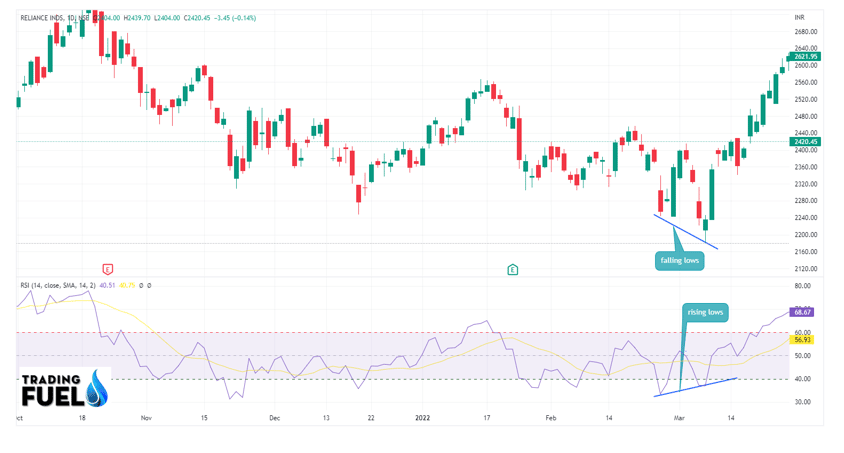
Here, we are looking at the chart of Reliance Industries.
The lower high in the RSI will indicate a higher low in the stock price movement.
Read More:Best Intraday Trading Indicator
Conclusion:
These were considered the best technical indicators for determining bullish trends as well as reversals.
FAQs
About Us:
Trading Fuel is our website for blogs where we provide you with insights into the stock market, finance, economics, technical analysis, etc. we wish you happy reading and ask us to
~stay tuned with us for more such blogs~
Contain & Image ©️ Copyright By, Trading Fuel || Research Lab