In this part, we will learn the Swing Trading Strategies. To learn this strategy, first we need to understand two important indicators that we are going to apply.
1. Leading Indicator: RSI (Relative Strength Index)
RSI is one of the most used ad popular momentum indicators. It gives signals on overbought and oversold conditions of stocks and it is plotted in a range between 0 and 100.
Generally, readings below 30 indicate oversold and readings below 70 indicate overbought level. It helps the trader to identify whether a stock’s price has been unreasonably pushed to current levels and whether a reversal may be on the way.
For swing trading, we can use it to pick potential tops and bottoms depending on whether the market is overbought or oversold. The best use of RSI is to identify the oversold conditions for buying opportunities and finding overbought conditions for selling opportunities.
From the below chart, you can see that RSI is below 30 levels, it indicates that there might be no more sellers left in the market and the current move could be over. Price may get reversed and headed back up over the next couple of weeks.

RSI is useful for conforming trend formations. If you want to confirm the trend, you can check the level of RSI. If you are looking for an uptrend, then make sure that the RSI is above 50 and for the downtrend, it should be below 50 levels.
RSI for Trend Confirmation
From this example, you can see that the possible downtrend was forming at point A. At the same time, RSI passes below 50 levels, so it is a good confirmation for the downtrend that formed.

2. Lagging Indicators MACD Indicator
Moving Average Convergence Divergence is an important indicator of our swing trading strategies. It is useful for identifying a new trend, whether it is bullish or bearish. As, trade with the trend is the priority in this strategy, so we have to understand the settings of the MACD indicator first.
MACD Setting:
The default setting for MACD is (12, 26, 9)
- The 12 stands for the previous 12 bars of the faster-moving average.
- The 26 stands for the previous 26 bars of the faster-moving average.
- The 9 stands for the previous 9 bars of the difference between the two moving averages. It is plotted by the vertical lines called a histogram.
The MACD Histogram plots the difference between the fast- and slow moving average. If you look at the chart, you can see that, as the two moving average separate, the histogram gets bigger.
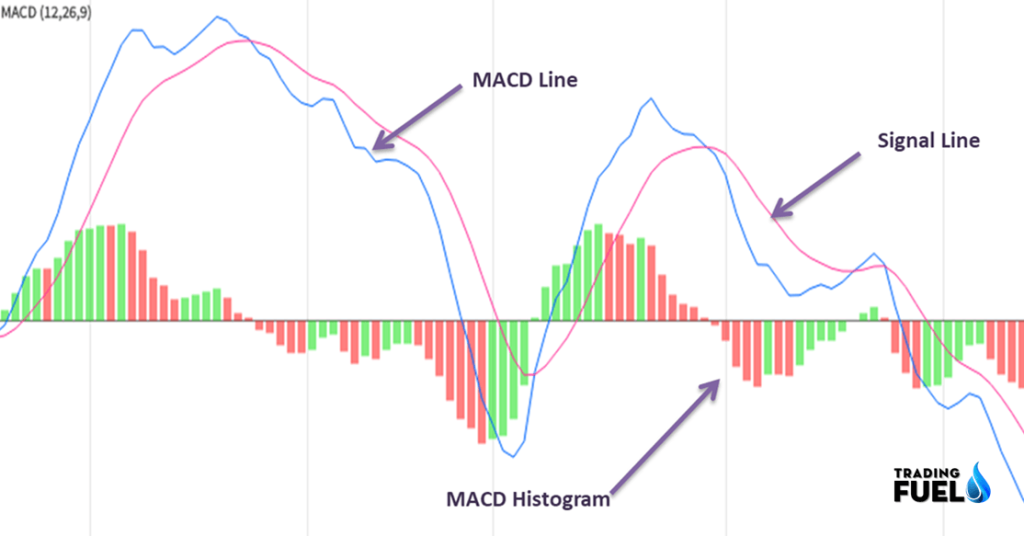
- In the above chart, MACD represented as a BLUE line.
- The red line is the MACD signal line.
- MACD line and trigger line moves above and below the zero lines, it means that the MACD can be a negative or a positive reading.
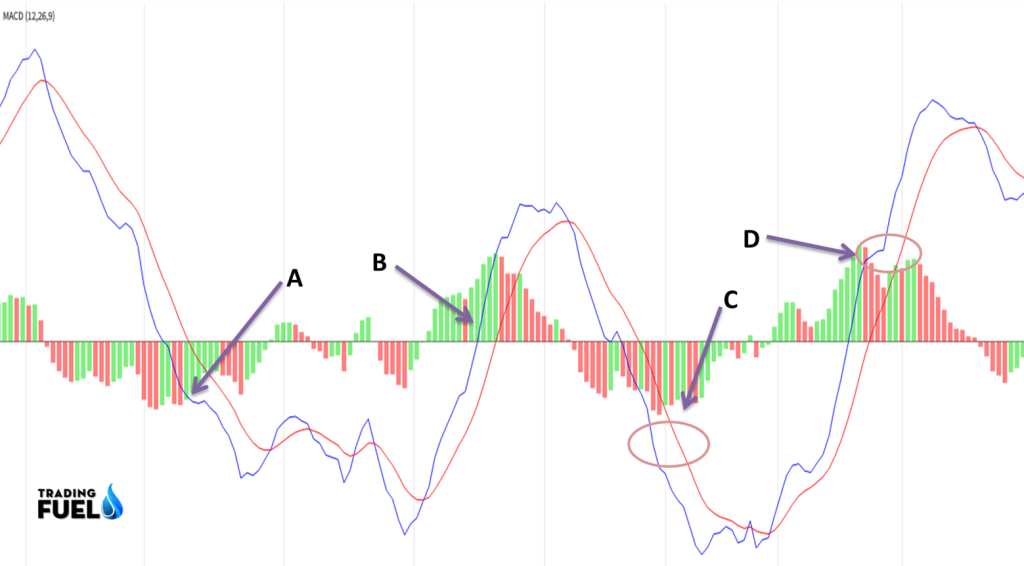
MACD Interpretation:
- MACD is below the 0, it indicates a downtrend. (see A point in chart)
- MACD above the 0, there is an uptrend. (see Point B in the chart)
- MACD line is above the trigger line (signal) line, is a bullish signal
- MACD line is below the signal line, it gives a bearish signal.
- When MACD below 0 and the signal line – it is a strong downtrend. (see point C)
- MACD is above 0 and the trigger (Signal) line is a strong uptrend. ( Cheek point D)
- MACD line is below zero but above the trigger (signal) line indicates a possible trend reversal.
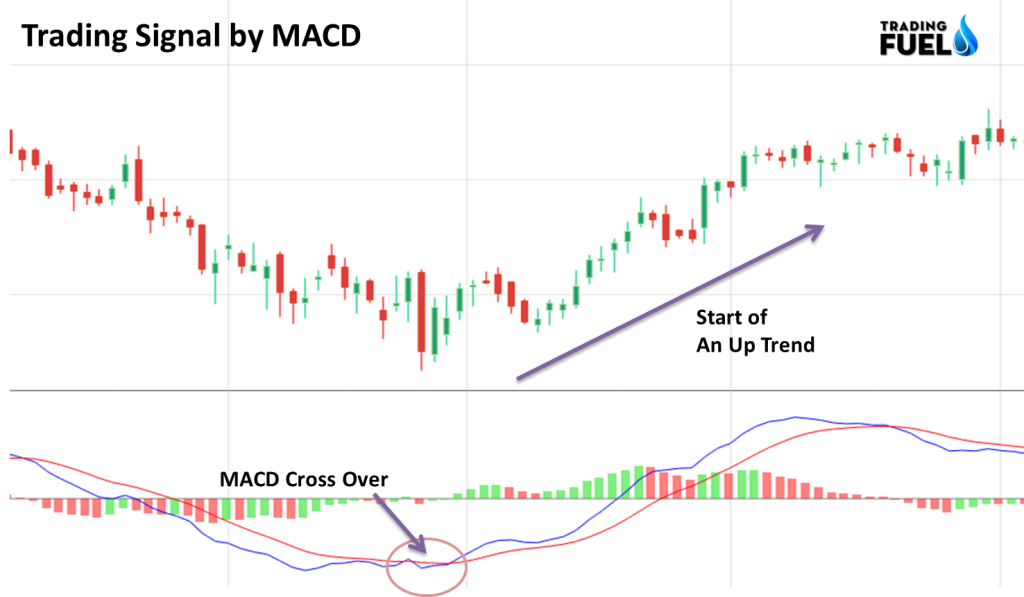
MACD Trading Signal
- There are two moving averages with different settings (‘speed’), the faster one will quickly react to price movement than the slower one.
- When a new trend occurs, the fast line will react first and eventually cross the slower line.
- When this Crossover occurs and the fast line starts to diverge or move away from the slower line, it indicates that there is a new trend started.
- When the MACD line crosses the signal line and the MACD line is above – it gives a buy signal.
- After the cross over, if the signal line is above the MACD line – it gives a sell signal.
In this given example, during the crossover of the MACD line and the signal line, the downtrend was over and there is starting of an Uptrend. And the MACD cross over gives Buy signal.
PSYCHOLOGY of HIGH and LOW
- The recent high range of any stock shows the maximum power of bulls or buyers and the recent range of low reflects the maximum power of the bears during the trading range.
- The closing price of the stock is the most important. Price may be pushed higher or lower during the day but the closing will indicate which group (buyer or sellers) is capable of closing the market.
- If the bulls are unable to close the market near the top of a rally, they are weaker than they seem and it creates a shorting opportunity.
- If sellers cannot close the market near the lows during a decline then they are weaker than buyers and it crates buying opportunity.
Swing Trading Strategies
We have seen the two important indicators that we are going to apply in the strategy. Now from below section, we will learn step by step Swing Trading strategies for intraday trading and Investors.
Swing Trading Strategies: Investors
Tools:
- Trend
- Area of Demand / Supply
- MACD
- RSI
Time frame: Daily Chart (Need at least 3-6 month for are of demand and supply)
Steps for Swing Trading Strategies for Investors:
Use a daily chart of a minimum of 3 to 6 months.
- Now add RSI and MACD indicator with default parameters
- Check trend of the stock.
- Draw trend line
- Look for the price making a high and higher high pattern or low and lower low pattern.
- Check the MACD is below or above 0.
- If MACD is below 0 and finds positive divergence. (Long Opportunity)
- If the MACD is above 0 and finds the negative divergence. (Short Opportunity)
- Now look for trend line breakout.
- RSI must come out from the oversold level (30) when there is a positive divergence in MACD.
- RSI must come out from the overbought level (70) when there is a negative divergence in MACD.
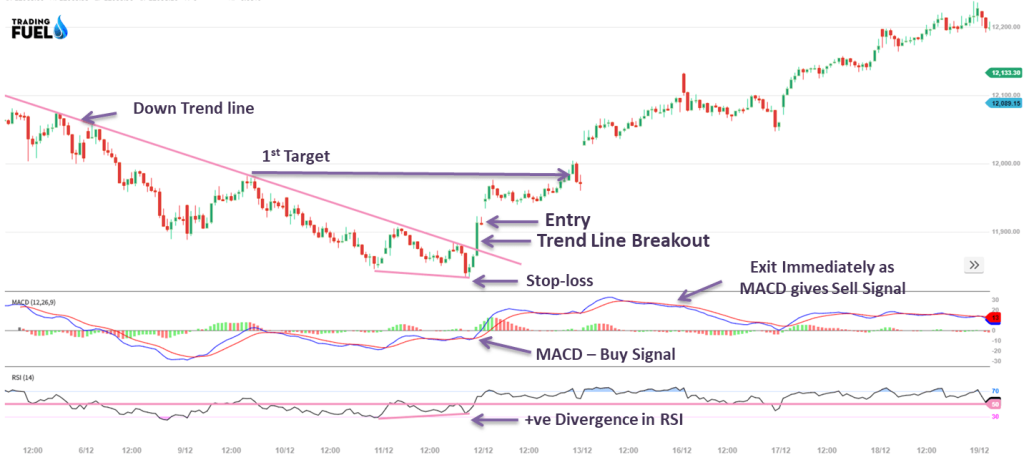
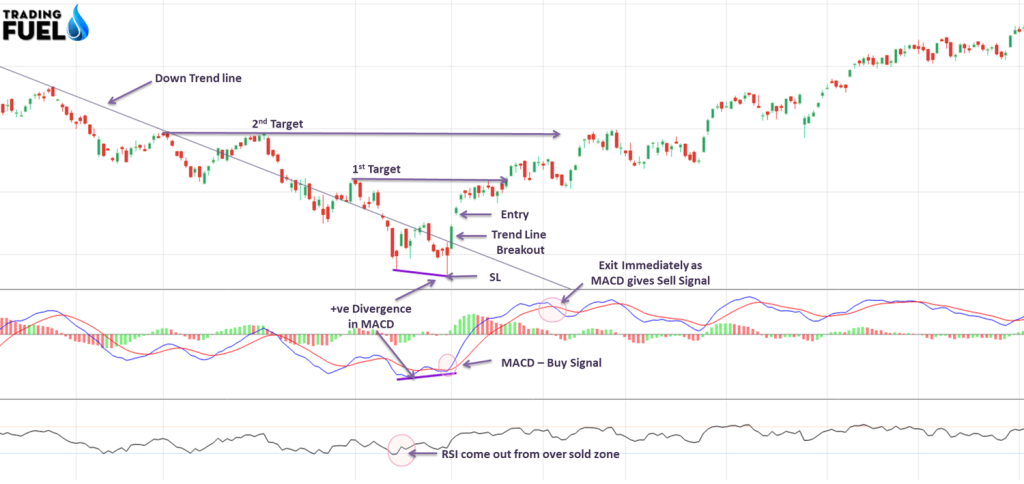
For Buy Trade
Entry:
- After Positive divergence, wait for bearish trend line breakout.
- Now check, MACD – buy signal.
- If MACD doesn’t give a buy signal then wait for it.
- For entering into a trade, take confirmation from RSI, it must be above 30 level
Stop Loss:
- Close below the immediate bottom
Target:
- Next are of Resistance 1 and 2
Exit:
- If you don’t get the target and get a Sell signal from MACD, then exit immediately.
Example for Buy Trade:

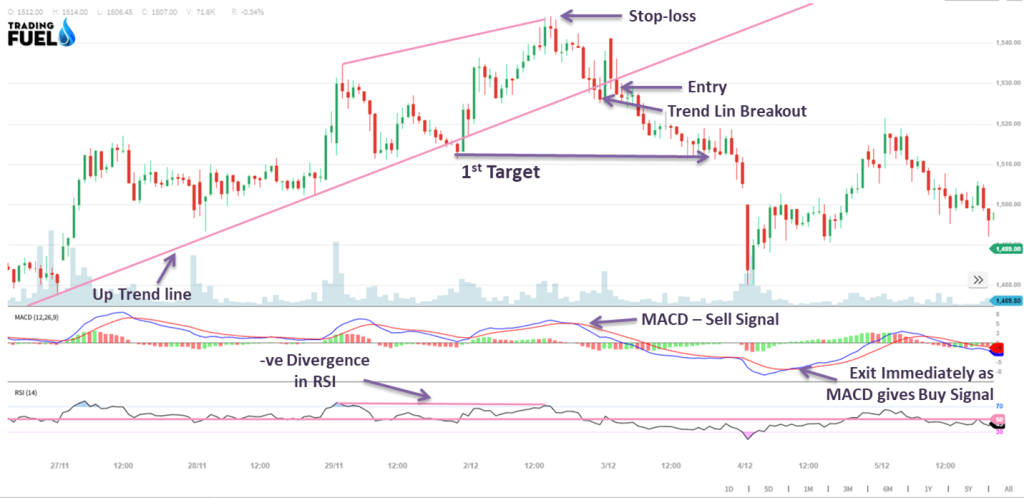
For Sell Trade
Entry:
- After a negative divergence, wait for the bullish trend line breakout.
- After trend line breakout, check for sell signal by MACD.
- If there is no sell signal, then wait for the sell signal.
- For conformation, see RSI. It must be below 70 levels.
Stop Loss:
- Close above the immediate top
Target:
- Next area of support 1 and 2
Exit:
- When MACD gives a Buy signal.
Example:
Swing Trading Strategies for Intraday Trading
- Use intraday chart of the last 5 days with the 15-minute timeframe.
- Add RSI Indicator with default parameters
- Check RSI above 50 or below 50 level
- If RSI is above 50, find negative divergence ( For selling opportunity)
- If RSI is below 50, Find the positive divergence ( Long opportunity)
- Conform to entering into the trade with the help of MACD Buy and Sell Signals.
- Target is an immediate demand area ( Support area)
- Stop loss is immediate supply is ( Resistance Area)
For Buy Trade
Entry:
- After Positive swing divergence with RSI.
- For entering into a trade, take confirmation from the MACD buy signal.
Stop Loss:
- Close below the immediate bottom
Target:
- Next are of Resistance 1 and 2
Exit:
- Sell signal from MACD
Example:
For Short Trade
Entry:
- After a negative swing divergence with RSI
- For conformation: check MACD sell Signal
Stop Loss:
- Close above the immediate top
Target:
- Next area of support 1 and 2
Exit:
- When MACD gives a Buy signal.
Example:
Money Management for Swing Trading:
Money management plays an important role in the trader’s journey. Here we will discuss four important parts of money management, that every swing trader should use.
1. Stop loss:
Stop-loss is a pre-determined price at which trader/investor will exit if the price moves adversely. If a stock is bought at 100 ₹ then you can put the stop loss at 98 ₹. If the price moves below 100 and reaches 98, trader will exit the buy position by taking loss of 2 ₹.
2. Trailing Stop loss:
When a trader enters into a position, and in the profitable situation trader continues to increase the stop loss to take advantage of any profitable trades.
As the price increases, the trader increases the trailing stop loss. If the tailing stop loss hit, then the trader will take the profit.
3. The risk to Reward Ratio:
It is the ratio between the amount of risk and the expected return.
- Risk: Difference between the entry price and the stop loss.
- Reward: Difference between the entry price and the target.
- The ideal risk to reward ratio is 1:2 ( i.e. risk of 1 ₹ and reward of 2 ₹) and 1:3
- R: R can be increased by using trailing stop loss
Importance of Risk to Reward Ratio
| Success Ratio | No. of time Stop-loss hit | Total loss @ 1 ₹ per trade | No. of times profit is earned | Profit Earned 2 ₹ per trade | Net Position |
| 40% | 6 | 6 × 1 = 6 | 4 | 4 × 2 = 8 | +2₹ |
| 50% | 5 | 5 × 1 = 5 | 5 | 5 × 2 = 10 | +5 ₹ |
| 60% | 4 | 4 × 1 = 4 | 6 | 6 × 2 = 12 | + 8₹ |
| 70% | 3 | 3 × 1 =3 | 7 | 37× 2 =14 | + 11₹ |
From the above table you can see that with an R: R of 1:2, money can be made even if you are right 40% of the time.
4. Position Sizing:
Position sizing is about making decisions regarding the number of shares/contracts to be entered in for a particular trade. The amount of money at risk in a single trade sets the ‘Size of Position’.
Now let’s determine how much money to lose in a single trade? By an example.
| Particulars | No Leverage | Leverage Position |
| Initial capital | 5,00,000 | 5,00,000 |
| Risk Appetite per trade @ 1% | 5,000 | 5,000 |
| Assumption | ||
| Buy Price | 100 | 100 |
| Stop Loss | 95 | 95 |
| Quantity of shares per trade | 1,000 | 1,000 |
| Position Value | 100,000 | 100,000 |
| Margin % | 100% | 25% |
| Capital Required | 100,000 | 25,000 |
| No. of positions that taken simultaneously with the same parameters | 5 | 20 |
If you start with 5, 00,000 ₹ of initial capital and risk per trade is 1% of total capital = 5,000 ₹. So if you buy a stock at the 100, your stop-loss is 95 with 1000 qty of share. So the maximum loss you can bear is 5,000 ₹ in one trade as per 1% risk appetite rule.
Now, let’s see how risk appetite helps us to protect our capital.
Therefore, to lose the whole amount (5, 00,000 ₹), how many times do you have to go wrong continuously? Now look at the 4 different scenarios:
| Scenario | Particulars |
| 1 | 2% loss of initial capital base |
| 2 | 1% loss of initial capital base |
| 3 | 2% loss of reduced capital base |
| 4 | 1% loss of reduced capital base |
Capital Preservation: Strict stop loss
| Particulars | Scenario 1 | Scenario 2 | Scenario 3 | Scenario 4 |
| Initial capital | 5,00,000 | 5,00,000 | 5,00,000 | 5,00,000 |
| 1st Trade | 4,90,000 | 4,95,000 | 4,90,000 | 4,95,000 |
| 2nd Trade | 4,80,000 | 4,90,000 | 4,80,200 | 4,90,050 |
| 3rd Trade | 4,70,000 | 4,85,000 | 4,70,596 | 4,85,150 |
| No of trades to lose capital | 50 | 100 | 228 | 458 |
So from, the above example, we suggest you always go with scenario 4, for better risk management.
Note: Tradingfuel.com provides free education through blogs. Strategies given in this blog is only for education purpose. We are not responsible for your profit or loss. Do backtest before using our swing trading strategies.