
What is a Candlestick Pattern?
Candlestick Pattern is a technique that was followed by the Japanese rice trader 400 years ago.
A candlestick is a graphical representation of the open, high, low, and close value for a given period.
Candlestick can be bullish, bearish, and indecisive.
There are lots of candlestick patterns, but for simplicity, we are going to discuss only the top 10 widely used candlestick patterns.
1. Doji Candlestick Pattern:
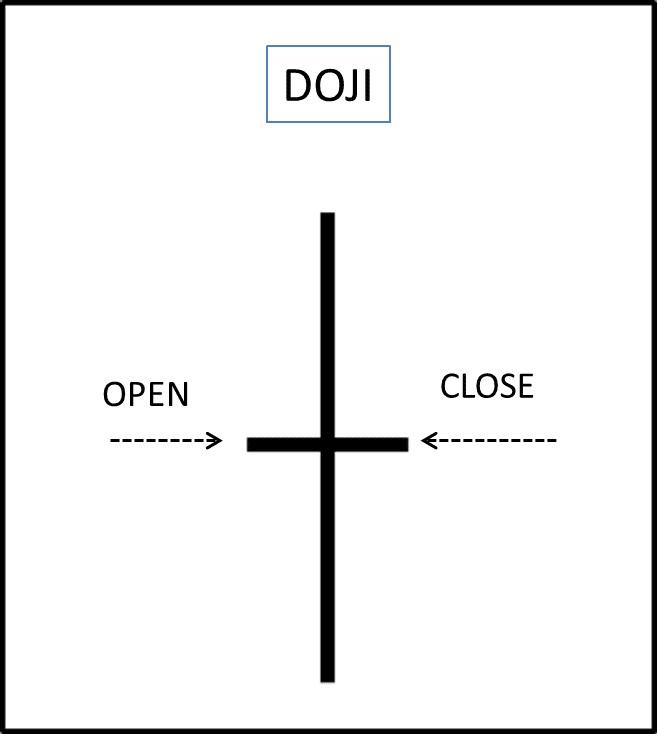
What does it look like?
A Doji represents an equilibrium between buyer and seller.
A tug of war that neither the bull nor bear are winning.
What does it mean?
In an uptrend, the bull has by definition won previous battles because the price has moved higher, a Doji occurring after a strong trend indicated a change in sentiment.
A Doji candlestick represents indecision in the market, as the price is unchanged.
How do we trade it?
Trade it like a reversal signal.
Or Treat it as a signal to stand aside.
2. Marubozu Candlestick Pattern:

What does it look like?
Marubozu is a long candle, indicating a long trading range dominated by bulls.
Marubozu candle lack either an upper or lower shadow.
On a rare occasion, it lacks both the upper and lower shadow.
Bullish marubozu is green, bearish marubozu is red.
What does it mean?
a green candle signals extreme conviction among buyers.
a red candle signals extreme conviction among the seller.
A full or nearly full marubozu implies that strong buying or selling interest is depending on the color.
How do we trade it?
Continuation patterns in a strong breakout aligned with the market bias.
3. Harami Candlestick Pattern:
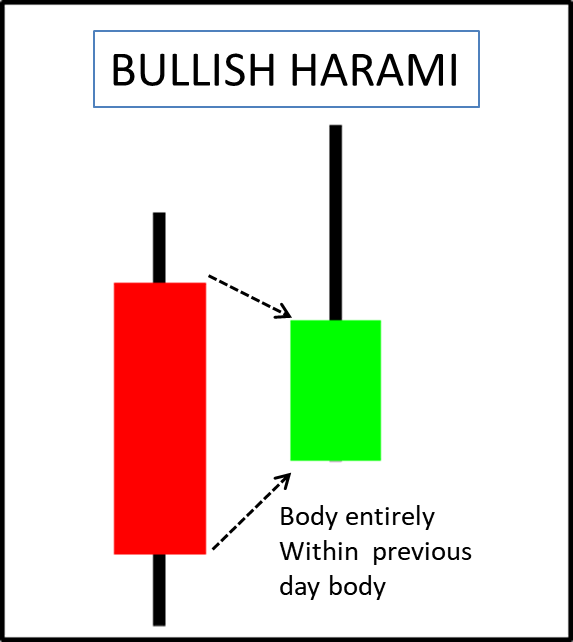
What does it look like?
Harami can occur in either a bullish or bearish trend.
Harami means pregnant lady in Japanese.
The first candle is a long-range candle and the second candle is of low volatility.
The body of the second candle must be entirely within the body of the first bar.
In bullish and bearish harami the upper and lower shadow can be of any size.
What does it mean?
Harami candle forming after a strong trend indicating a reversal point.
A large red body candle contains a smaller green body candle is a bullish reversal harami.
A large green body candle contains a smaller red body candle is bearish reversal harami.
Compare to engulfing candle pattern harami is a weaker pattern in terms of the strength of the pattern.
A harami pattern shows a decrease in the volatility of the price.
How do we trade it?
In an uptrend, we use the bullish harami to spot the end of the bearish retracement.
In a downtrend, we use the bearish harami to spot the end of the bullish retracement.
4. Engulfing Candlestick Pattern:
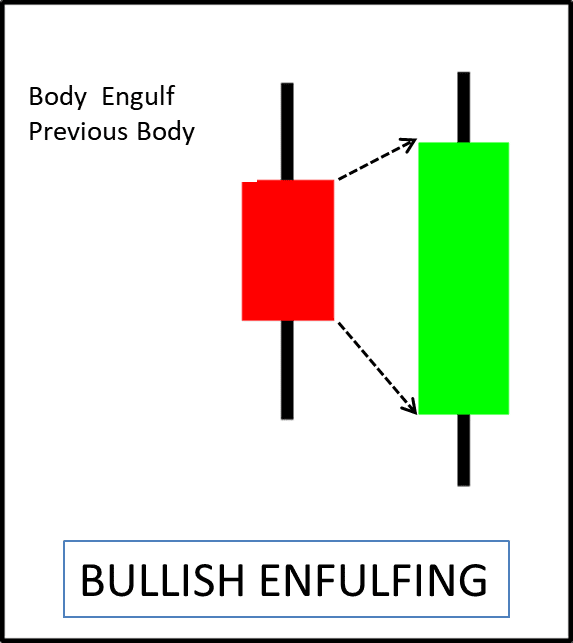
What does it look like?
The body of the second candle completely engulfs the first candle body.
Bullish engulfing occurs after a significant downtrend.
Bearish engulfing occurs after a significant uptrend.
What does it mean?
Here as the second candle completely engulfs the first it represents a strong reversal signal.
For bullish reversal, a stock must be indefinite downtrend before the bullish engulfing pattern occurs.
For bearish reversal, the stock must be indefinite uptrend before the bearish engulfing pattern occurs.
How do we trade it?
In the bullish trend buy after a candle close above the high of the bullish engulfing pattern.
In the bearish trend sell after a candle close below the low of the bearish engulfing pattern.
5. Piercing Line/ Dark Cloud Cover Candlestick Pattern:
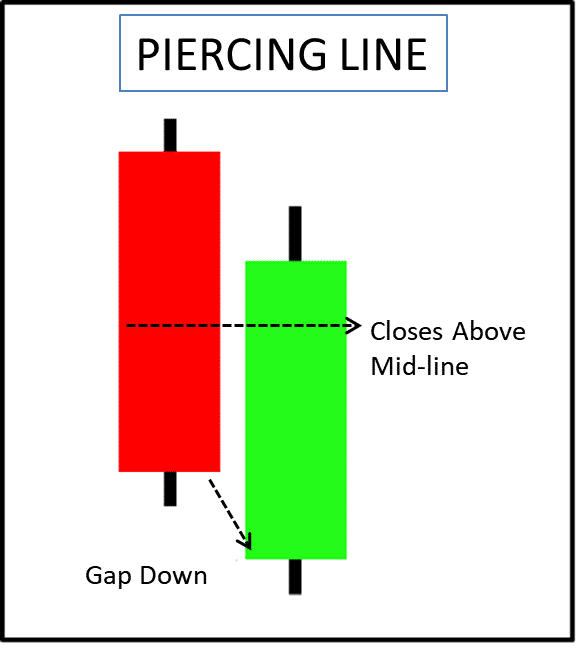
What does it look like?
Piercing Line is a two-bar bullish reversal pattern and dark cloud cover is a two-bar bearish reversal pattern.
On the dark cloud cover day, the stock closes at least halfway into the previous green candle.
The larger the penetration of the previous candles the more the powerful the signal.
In the classic piercing pattern the next day’s candle gaps below the previous day’s low.
What does it mean?
1. Piercing pattern
The stock should be in a downtrend before this signal occurs.
The second day of the signal should be a green candle opening below the low of the previous day and closing more than halfway into the body of the previous day’s red candle.
2. Dark cloud cover
The stock should be in an uptrend before this signal occurs.
The second day of the signal should be a red candle opening above the high of the previous day and closing more than halfway into the body of the previous day green candle.
How do we trade it?
You can trade reversal setup after a candle gives close above the high of the piercing line patterns.
For bearish setup, entry is done after a candle gives closes below the low of the dark cloud cover pattern.
6. Hammer/Hanging Man Candlestick Pattern:
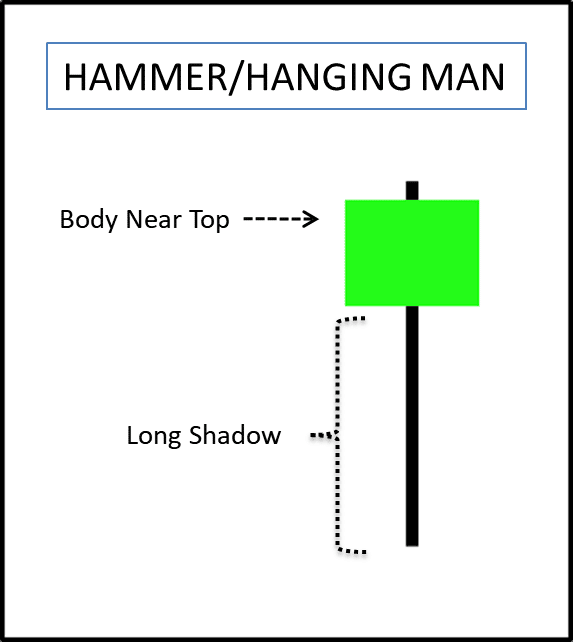
What does it look like?
Both the hammer and hanging man patterns look the same.
Both have
- A candle close near the top of the candlestick
- A long lower shadow
Hammer patterns are found after a market decline and it is a bullish signal.
Hanging man appears at the end of a bull run and it is a bearish signal.
What does it mean?
The hammer pattern traps the retail trader who has sold in the lower region, forcing them to cover their short. This caused an increase in buying pressure.
Hammer is a bearish reversal pattern.
The hanging man pattern traps the buyer, as the trend is infected by the optimism trader buys into market confidence.
When the market falls later it jerks this buyer out of their long position. This caused an increase in selling pressure.
Hanging man is a bearish reversal pattern.
How do we trade it?
In a downtrend buy after a candle closes above hammer pattern high.
In an uptrend sell after a candle closes below hanging man pattern low.
7. Inverted Hammer/Shooting Star Candlestick Pattern:
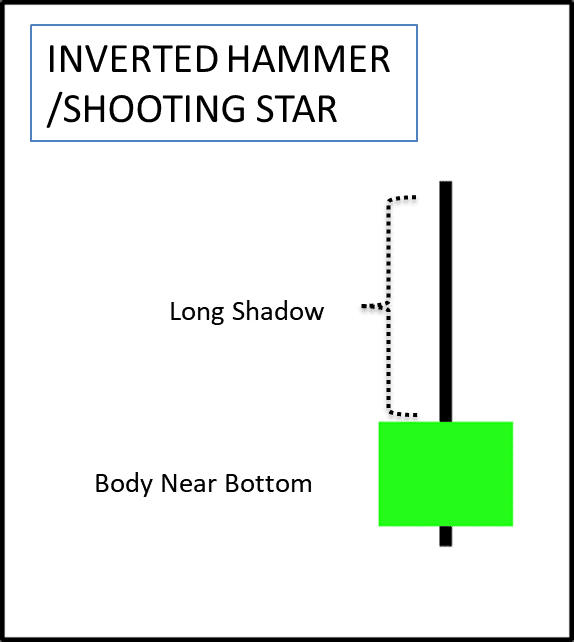
What does it look like?
Inverted hammer and shooting star are exactly opposite of the hammer and hanging man pattern.
The inverted hammer is identical to the shooting star pattern.
The only difference is where they form (top and bottom).
An inverted hammer is formed at the end of the downtrend while shooting star is found at the end of an uptrend.
What does it mean?
The inverted hammer is a bullish pattern. It traps the seller who sold it in the lower range.
Inverted hammer form in a downtrend after it trap the sellers. Impulsive buying of shares creates buying pressure.
The shooting star is a bearish pattern. It traps the buyer who brought it in a higher range.
Shooting star form in an uptrend after it traps the buyers. Impulsive Selling of share creates selling pressure.
How do we trade it?
In a downtrend buy after a candle close above the high of the inverted hammer pattern.
In an uptrend sell after a candle close below the low of the shooting star pattern.
8. Morning Star/Evening Star Candlestick Pattern:
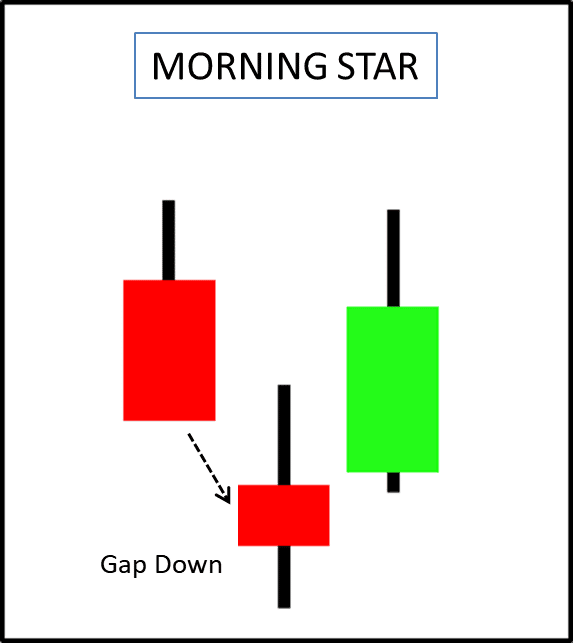
What does it look like?
Both morning star and evening star are three bar patterns.
In the three-bar pattern, star refers to a second candlestick with a smaller body that does not overlap with the preceding candle body.
As the second candle does not overlap forming a star will involve a gap.
- A morning star sequence is:
- A bearish candlestick
- A star below it.
- A bullish candlestick that closes above 50% of the first body.
- An evening star sequence is:
- A bullish candlestick
- A star below it.
- A bearish candlestick that closes below the 50% of the first body.
What does it mean?
- A morning star.
The first candle in the morning star pattern shows the bears in control.
The second candle indicates a change in market sentiment.
The third candle confirms the presence of the bull in the market.
- An evening star.
The first candle in the evening star pattern shows the bulls in control.
The second candle indicates a change in market sentiment.
The third candle confirms the presence of a bear in the market.
How do we trade it?
Buy above high of the morning star pattern.
Sell below low of the evening star pattern.
9. Three White Soldiers/Three Black Crows Candlestick Pattern:
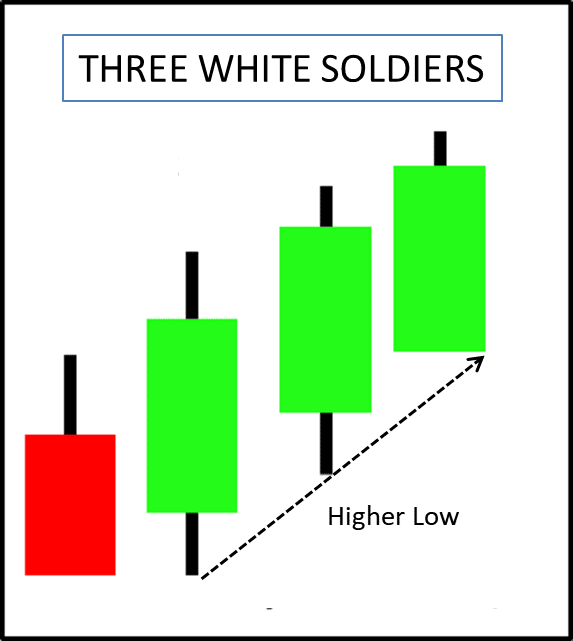
What does it look like?
Three white soldiers is a bullish continuation pattern, while the three black crows is a bearish continuation pattern.
These patterns are more potent then it occurs after an extended decline and a period of subsequent consolation.
What does it mean?
Each candlestick in the three white soldiers should open within the previous candle body and close near its high. However, each bar closes up with a strong and higher close.
Each candlestick in the three black crows should open within the previous candle body and close near its low. However, each bar closes down with a strong and lower close.
How do we trade it?
These patterns are effective for reversal trading.
Buy above high of three white soldiers after a market decline.
Sell below low of three black crows after a market rise.
10. Tweezers Top and Bottom Candlestick Pattern:
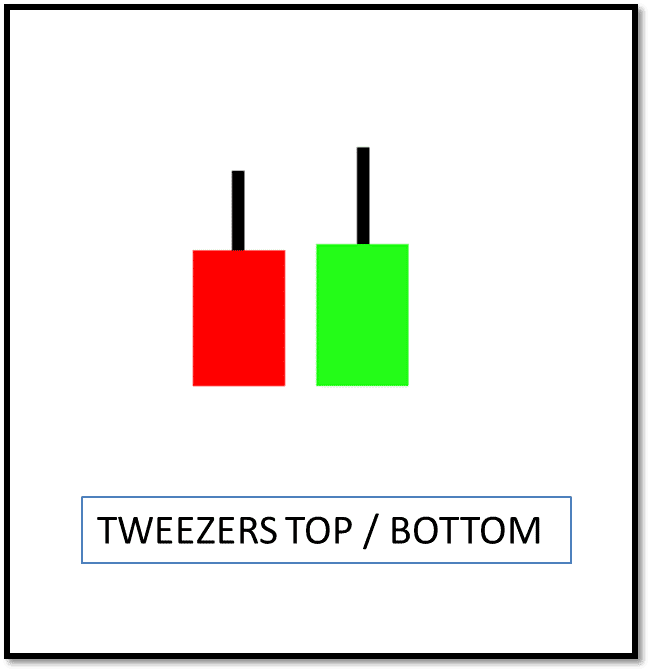
What does it look like?
Tweezer formation always involves two candles.
A tweezer top involves two candles whose highs are identical.
A tweezer bottom involves two candles whose lows are identical.
What does it mean?
Tweezers’ top and bottom patterns are reversal patterns.
Tweezers’ top is formed by two candlesticks that make an identical high.
Price in unable to break the high of the first candle and fall came from the same price level will result in the formation of the Tweezers top.
Tweezers bottom is formed by two candlesticks that make an identical low.
Price in unable to break the low of the first candle and rise came from the same price level will result in the formation of the Tweezers bottom.
How do we trade it?
Bullish reversal confirmation only comes after price close above the high of the tweezers bottom pattern.
Bearish reversal confirmation only comes after price close below the low of the tweezer’s top pattern.
Conclusion:
In this article, we have covered the most basic form of price action trading i.e. candlestick pattern. We have discussed in detail about the top 10 candlestick pattern which repeatedly occurs in any financial market. Candlestick is not a reliable form of analysis it must be used in conjunction with other techniques. Also, the period of the candle is very important in determining its accuracy as higher time frame patters are more accurate than lower time frame patterns.
Contain & Image ©️ Copyright By, Trading Fuel Research Lab