
Continuation Chart Pattern: Part-4 | Triangle Pattern, Flag Pattern & More..
1. Triangle Pattern:
Triangle patterns are continuation pattern, they represent the equilibrium condition.
Such a pattern usually occurs due to the balance of force between the buyer and seller.
Triangle pattern has a higher success rate as compared to other patterns.
Breakout of a triangle pattern will result in a sharp move in price.
It represents the indecisiveness between the buyer and seller as both are not showing any interest in the current price.
Triangle pattern is easy to identify and it represent sideways movement of price.
Triangle pattern is further classified into:
- Symmetrical pattern
- Ascending pattern
- Descending pattern
a. Symmetrical Pattern:

Symmetric triangle form when the market is in an indecision mode
They can be easily identified when the price makes alternating “lower high” and “higher low”.
The symmetric triangle form when the supply and demand are equal amounts.
The symmetric triangle gives a clear breakout of pattern.
Trade:
We will only enter into a trade if the price breaks the trend line of the triangle.
We will enter into a trade only when breakout/breakdown is confirmed by price trading above the high of the breakout candle.
Target:
Most of the time after breakout the price will rise to 100% of the depth rise/fall of the entire triangle range.
The minimum target can be kept at 50% of the depth form the trade entry.
Stop:
Symmetric triangle failure occurs when the price results in the false breakout.
For long setup, slot loss order can be kept at the previous swing low of the triangle.
For a short setup, a slot loss order can be kept at the previous swing high of the triangle.
b. Ascending Pattern:
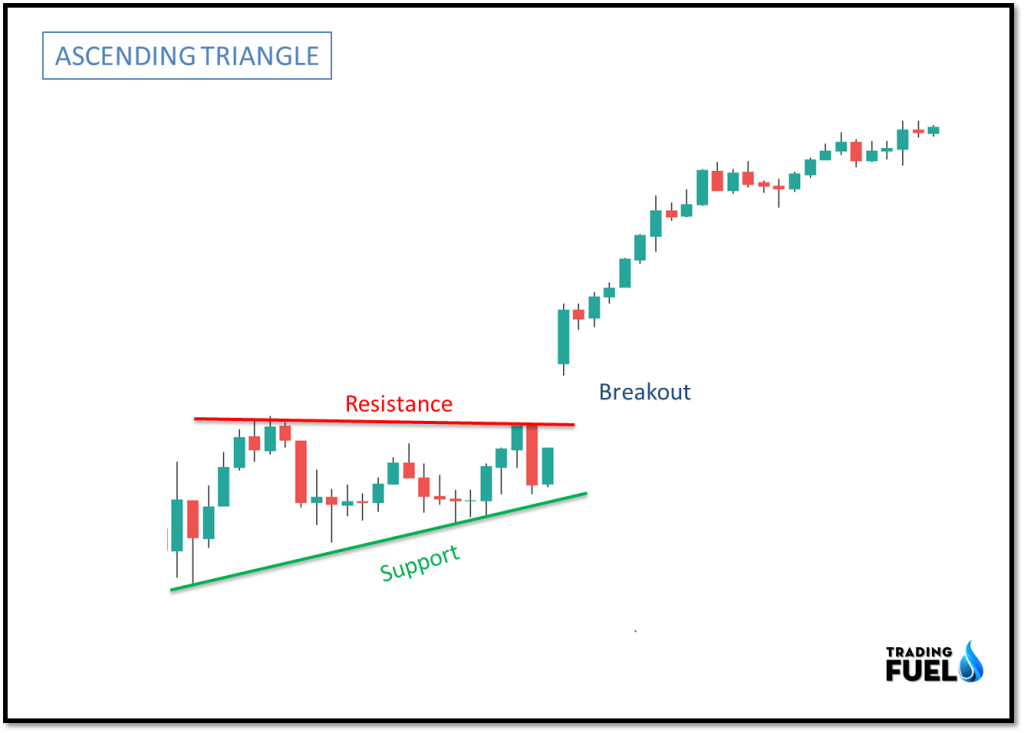
Ascending triangle form when the price attempt to make “higher high” and “higher low” indicating a bullish move.
The ascending triangle is bound by two trend lines, a horizontal line at the top and an upward slope trend line connecting “higher low”.
Ascending triangle forms after a bullish move and is quite reliable.
The price must intersect the trend line at least twice to form an ascending triangle pattern.
A breakout occurs near the apex point and after three or four attempts to break the trend line.
This pattern is highly reliable.
Trade:
Enter a long trader above the high of the breakout candle.
Confirm the entry with an increase in volume.
Target:
Most of the time after breakout the price will rise to 100% of the depth.
Measure the depth between the top trend line and lowest of the upward slope trend line.
The minimum target can be kept at 50% of the depth form the trade entry.
Stop:
Stop-loss orders can be placed below the lower trend line or at major swing low.
c. Descending Pattern:
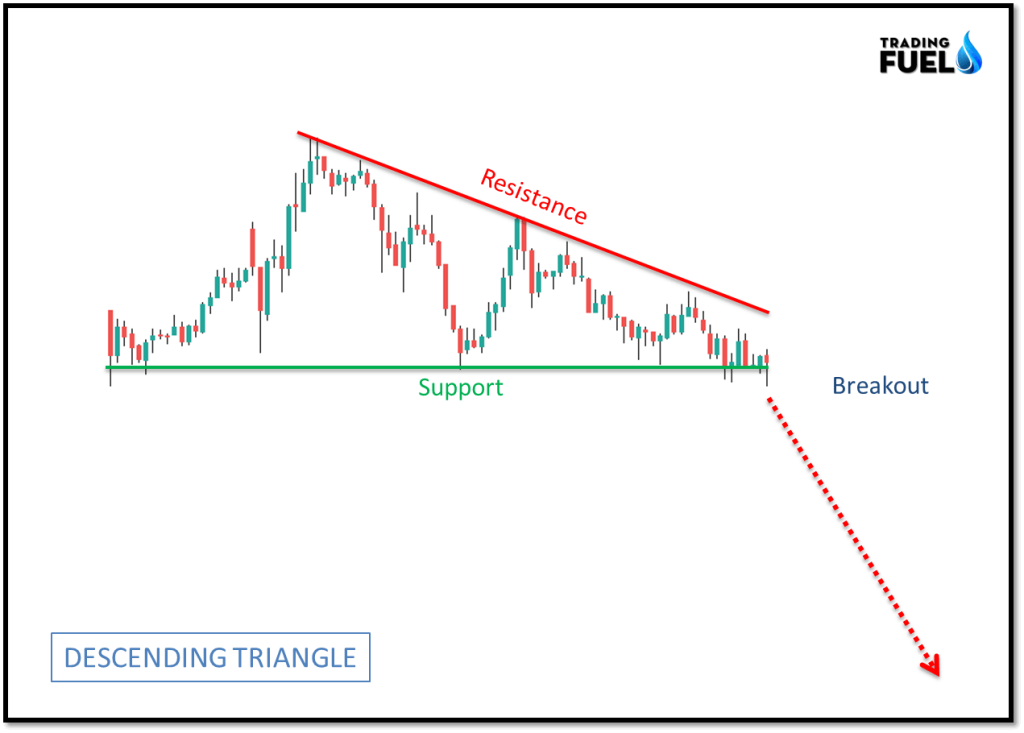
The descending triangle is similar to the ascending triangle except they are bearish.
Descending pattern form in a bear market and favor breakdown.
A descending trend line is bound by two trend lines connecting a downward slope trend line and flat trend line connecting the swing low.
Trade usually occur near the apex point of the triangle.
The price must touch the trend line at least two times before the pattern emerges.
Descending patterns also have a higher success rate.
Trade:
Enter a short trader below the low of the breakout candle.
Confirm the entry with an increase in volume.
Target:
Most of the time after breakout the price will fall up to 100% of the depth.
Measure the depth between the lower trend line and the highest point of the above trend line.
The minimum target can be kept at 50% of the depth form the trade entry.
Stop:
Stop-loss orders can be placed above the higher trend line or at the major swing high.
2. Flag Pattern:
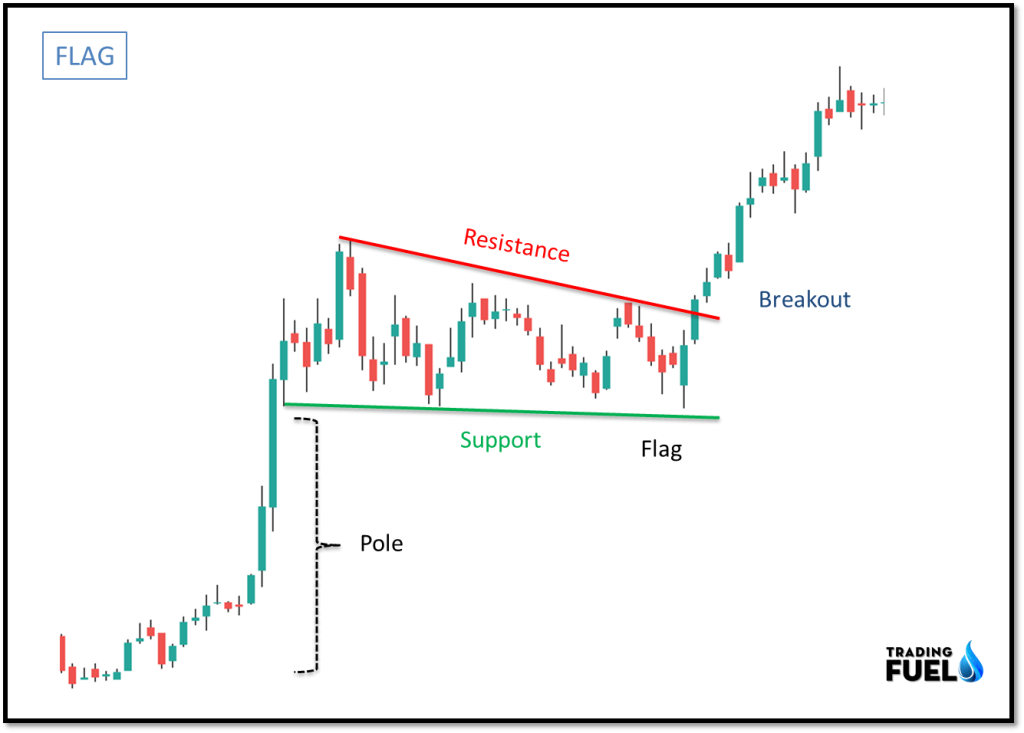
Flag patterns are a continuation pattern representing a small pause in the market trend.
They are easy to stop because of their simple structure.
Flag pattern forms a price pause and moves in the direction of the prior trend after a clear breakout.
Flag pattern occurs because the price has moved too far in a short period.
A bull flag is spotted in a bull market and bear fag are in a bear market.
The trend lines (upper and lower trend lines) are parallel to each other.
Trade:
Trade can only be entered after the price gives a clear breakout of the upper or lower trend line.
Long entry can be done above the high of the breakout candle.
Short entry can be done below the low of the breakout candle.
Another sign of the clear breakout occurs when the price trade above the recent swing high or swing low.
Target:
The minimum target for a breakout trade can be kept at 50%-70% of the pole of the flag.
Pole of the flag is a distance between the highest or lowest points of the flag to low of the rally.
Stop:
Stop-loss orders can be placed below the low of the flag for a long trade.
Stop-loss orders can be placed above the high of the flag for a short trade.
3. Rectangle Pattern:

Rectangle patterns are continuation patterns showing halt in the trend.
Rectangle patterns are reliable patterns and the direction of the breakout is known before the rectangle formation.
Rectangle formation is bound by two horizontal trend lines where price oscillates between the high and lows.
The price must touch these lines at least twice before a breakout occurs.
The volume within the patterns is increasing during the breakout.
Trade:
A trade setup occurs when a price successfully closes outside the trend line.
Long trade can be entered after a candle close above the high of the breakout candle.
Short trade can be entered after a candle close below the low of the breakout candle.
Target:
Target in rectangle formation is based on the depth of the rectangle pattern.
Target is usually set for 70% to 100% of the depth of rectangle from trade entry.
Stop:
Rectangle pattern failure occurs when the price after breakout retrace into the middle of the rectangle channel.
Stop-loss orders can be placed at the midpoint of the channel.
Conclusion:
In this article we have discusses most of the continuation chart patterns which occur regularly. As the continuation chart patterns breakout is in the direction of the main trend it’s easy to trade them and they are more reliable then reversal patterns. We have completely discussed how you can trade a pattern and place your stop loss and exit accordingly. The chart pattern is more reliable than the candlestick pattern as they take more time to complete. For a beginner, it is easy to spot chart patterns and probably the most reliable setup to trade.
Contain & Image ©️ Copyright By, Trading Fuel Research Lab