
How to do The Technical Analysis (Beginner’s Guide): If you are a trader, then you will have to at least learn the basics of technical analysis.
The main purpose of doing a technical analysis of stocks is to give the traders an idea about the future price of the stocks after studying their past behavior.
What is technical analysis?
- Technical analysis is the method of analyzing the market and focusing on the trends in the prices as well as the trading volume.
- This will help the traders to identify the areas where there may be some sort of potential opportunity for profit or risk reduction.
- Technical analysis will also give you warning signs to avoid a particular trade if it is not yielding good returns.
- You might see that one day the share price is up, whereas on the other day it is down.
- With the passage of time, if you look at the price movement of the shares, you will see trends and various patterns that will emerge.
- The entire study of these trends and patterns is known as the technical analysis of stocks.
Technical analysis vs. Fundamental analysis:
There is also another form of analysis, which is known as fundamental analysis.
The main difference between the two is as follows:
| Basis | Technical analysis | Fundamental analysis |
| Use | This is used to forecast the price movements by using various candlestick chart patterns as well as technical indicators. | This will include analyzing various news, economic data, and central bank updates so as to anticipate future price movements. |
| Focus | The main focus here is on either short-term or medium-term trading. | The main focus here is on either medium-term to long-term time horizon. |
- If you want to know which form of analysis is the best, then you will have to consider both options.
- Beginners find that it is easy to start with technical analysis and then go with fundamental analysis later on.
- Whereas, some traders will simply rely on technical analysis while some on only fundamental analysis.
Must Know:Best Technical Analysis Courses in India
Assumptions of technical analysis:
If you wish to understand technical analysis in depth, then you will have to first understand the assumptions that are applied in technical analysis.
The following are the main assumptions that are used in technical analysis:
| Assumption | Basis |
| Stock market & reflection of known information | Here, all the components that have an impact on the stock prices have already been brushed off in the current situation. Hence, we can presume that the stock price is neither underpriced nor overpriced. |
| Price movement prediction | The movement of the stock price has no particular pattern but this theory will define the logic and will also state that it is possible to predict and chart any price movement of the stock. This assumption will also state that once you understand the market thoroughly, you will be able to easily strategize buying stocks at a very low price and then selling them when the price moves upwards. |
| History | It is also assumed that from time to time marketers will react to the stock price movements and this is because the market trend might repeat itself. |
| Charts and graphs for stock price trends | These are used and brought in technical analysis to understand and read the spot price trends. Charts will play a pivotal role in aiding the traders to understand the trend in the price movement. They will also help to predict whether the current stock price is heading upwards or downwards. |
| Focus on a short period | The primary focus of technical analysis is to aim at concentrate on short time durations that can be as long as one month or even a minute shorter. |
| Downtrends | Here, the market situation is such that it is continuously on the downside. In this trend, investors will refrain to buy the stocks and then wait for the prices to rise a little so as to sell off their holdings. |
| Horizontal trends | These are the chart patterns that are formed by drawing trend lines for both the high and low prices on the chart. Here, the situation of the market is at times unpredictable and in such cases, traders are not sure whether to purchase or sell a stock. |
| Support and resistance | Support refers to the downtrend where the investors buy stocks as the prices begin to go down, whereas resistance is a point where the stock is at the highest price point before the investors start selling the same, and then the stock price will begin to go down again. |
| Use of the moving average technique | This technique is basically used for predicting long-term investment. This trend indicator will give us a concise as well as a clear image of the entire market trend. |
| Indicators and oscillators | Indicators are the calculations where the analysts will apply various mathematical formulas to prices and volumes. An oscillator, on the other hand, is an indicator that is used to discover short-term overbought as well as oversold stocks. |
| Trade volume | If you are planning to understand the movement of the stock trend, then you will have to keep a close tab on the volume of the trades. |
Must Read:Best Technical Analysis Books
How to do the technical analysis?
- Firstly, to do technical analysis, you will need a trading plan.
- Before moving on to the technical part, you will have to make sure that your charts are clean, which means that there should not be any technical indicators on your chart.
- After doing your technical analysis, you will have to keep track of your observations.
- This can be done by either writing them down or highlighting them visually.
The following are the main steps that will guide you through performing technical analysis:
Also Know:Best Sites for Indian Stock Market Analysis
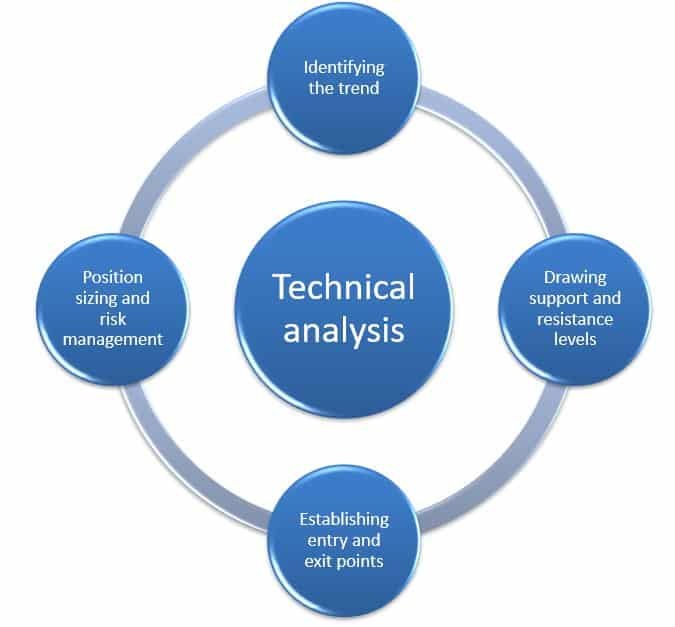
Identifying the trend:
- This is the very first step in the technical analysis for traders because all the trading strategies can either follow the trend or go against the trend.
- For each of the systems, you will have to identify whether the trend is upwards, downwards, or sideways.
- Each of the above three trends will have a different trading approach.
- Here, you will need to demonstrate the trend-following trading system.
- For this system, traders will generally buy or take long positions in the assets that are in the uptrend.
- Assets that are in a downtrend are short-sold.
- Instruments that are in the trading range are entered into at support or resistance levels where the trader believes that there is a very high likelihood of trend reversal.
Drawing support and resistance levels:
- Support and resistance levels are the areas where the price of an asset is likely to reverse or go for a breakout.
- Support is a level where the downtrend of an asset will pause because the buying demand increases and, hence, the trend will reverse and turn upwards.
- The same is the case with the resistance levels, where the uptrend of the asset will weaken, and hence the price is likely to reverse and then head downwards.
- These levels tend to provide excellent opportunities for traders to open new trades.
Establishing the entry as well as exit points:
- With the help of support and resistance levels, you can also identify the right entry and exit points.
- There are also other factors that will determine the same, such as the Average True Value (ATR) and the Relative Strength Index (RSI).
Position sizing and risk management:
- Technical indicators such as ATR and RSI are very commonly used by professional traders to help them with position sizing as well as risk management.
Why do we use technical analysis?
There are many reasons why traders will require technical analysis.
They are as follows:

Conclusion:
We hope that the above blog has given you a basic idea of technical analysis.
Frequently Asked Questions (FAQs)
About Us:
Trading Fuel is our website for blogs where we provide you with knowledge about finance, economics, the stock market, as well as intraday trading.
~Stay tuned with us for more blogs~