Introduction
Average True Range (ATR) Was Developed By Sir J Welles, this Indicator Measure The Volatility Of The Underlying Stock It Was Originally Developed For The Commodities And Used In The Daily Time Frame Unlikely The Stock, Commodities Are More Subjected To The Opening Gap, And Any Other Volatility Based Indicator Which Calculate Volatility based on The High And Low Would Fail To Reflect The Volatility Of Opening Range But This Problem Is Solved By ATR Indicator, Along With Commodities It Also Work Well In Liquid Market Like Index, Forex And Stock.
We Should Note That ATR Is Not A Directional Indicator, It Does Not Tell Us Either The Stock Will Go Up Or Down, It Only Tell If Stock Is In Trending Market Or Side Ways Market, Which Is Very Important To Know For Trader Who Uses Lagging Indicator Like (Moving Average, Super trend, Vwap Etc.) Because These Are Trend Based Indicator Which Work Only In A Trending Market, In Side-Ways Market Such Lagging Indicator Will Give False Signal And As A Result Of Which The Trader Can Losses Trust In His System With The Use Of ATR Trader Can Spot A Possible Side-Ways Market, And Prevent The False Entry.
The formula of ATR Indicator
Just Like A Moving Average, It Is Also Calculated Based On the Prior 14 Period True Range Average by Default,
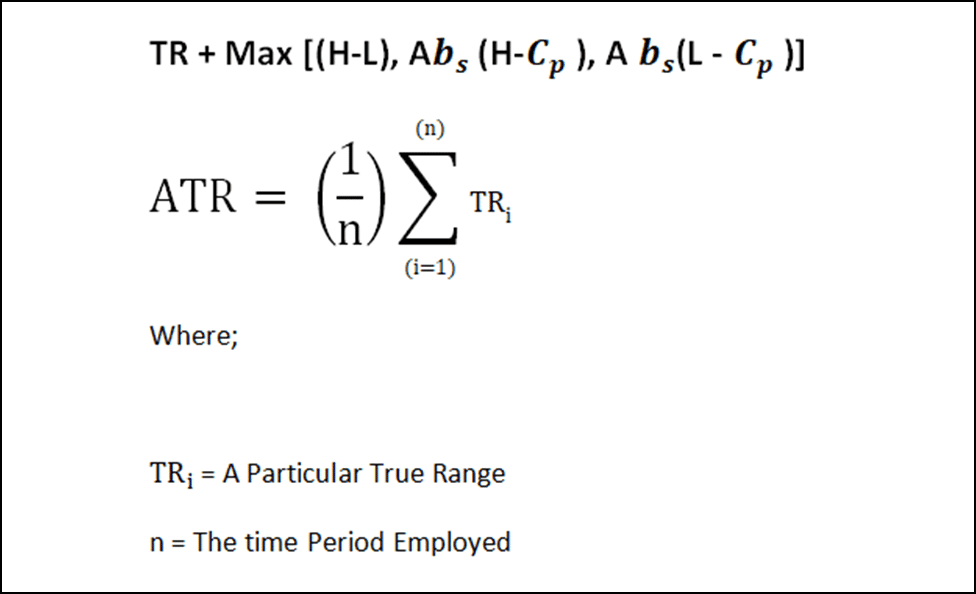
Calculation of Average True Range (ATR) Indicator
As The ATR Is The Average Of The True Range Wilder Propose Three Method For Calculating The True Range.
Method 1 = Current High – Current Low
Method 2 = Current High – Previous Close (Gap Up Days)
Method 3= Current Low – Previous Low (Gap Down)

1: If The Current High And Low Are Higher And Lower Then The Previous Day High And Low, Then The True Range Will Be Current High Minus Current Low.
2: If The Current High Is Above The Previous High Then True Range Will Be Current High Minus Previous Close.
3: If The Current Low Is Below The Previous Low Then True Range Will Be Current Low Minus Previous Close.
How to Use Average True Range (ATR) Indicator?
- ATR Value Represent the Average of Previous 14 Day (default Value) Individual True Range.
- In Most of Charting Software the By Default Range Of ATR Is 14, Trader Can Modify That & Use Shorter Period to Generate More Trading Signal.
- Where As The Longer Period Will Generate Less Trading Signal, This Range Will Be Different For Different Stocks, Some Stock Are More Volatile Than Other So We Have To Use A Longer Period Average, Where As For Share Which Is Less Volatile We Have To Use Shorter Average.
- Trader Must Back Test His Period Range, Rather Than Blindly Following A Value. True Range It Can Be Calculated In Daily Weekly or Monthly Time Frame.
- ATR Reflect The Absolute Price Change, That Is The Difference Of (Current High Minus Current Low) Or (Current High Minus Previous Close) Or (Current Low Minus Previous Close) Which Is The Absolute Price Change Of The Stock It Self.
- So ATR Represent The Volatility At The Absolute Level, In Another Word It Is Not Represented based on Closing Percentage, Which Means Low Price Stock Will Have Lower ATR Value Then High Price Stock Because Of This We Can’t Compare Two Stock Through Their ATR Value
For Example
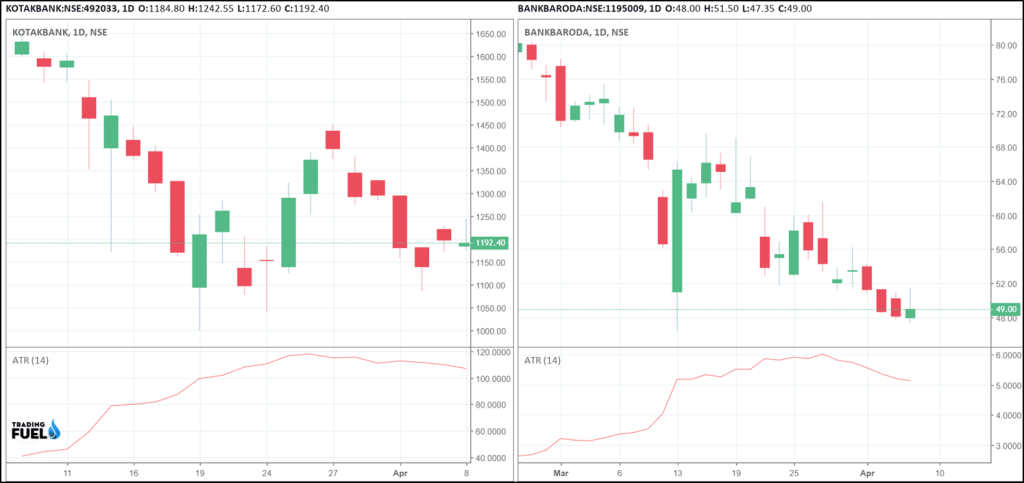
Here The ATR Of Kotak Bank is In the Range Of 40-120 While for the Bank of Baroda ATR Is in the Range Of 3-6 If Anyone Will Compare These Stocks Then He Will Come To An wrong Conclusion
While The 40 Is Lower Band For The Kotakbank It Is Still Way Higher Than The Higher Band Of Bankofbaroda So Correct Knowledge Of Any Indicator Is Important Before Using It In Any Trading System.
Notes:
- Average True Range Is A Technical Indicator Which Measures Market Volatility.
- It Is Derived From The 14-Day Moving Average Of Prior 14 Days True Range.
- It Was Developed To Use In Commodities Markets But Has Since Been Applied To All Kind Of Liquid Securities.
What Does Average True Range Tell Us :
Reading the ATR Indicator Is Simple
If ATR Rise It Means It Is A Trending Market.
If ATR Fall It Means A Sideway Market Or Consolidation.
ATR Does Not Give Any Information About The Direction Of Trend It Only Tell Us About The Possible State Of Market Trending Or Sideways.

Here We Have Taken Example Of Nifty 50,
In Phase 1:
ATR Value Of Nifty 50 Rises From 80 To 180 Level This Indicate Trending Market As ATR Value Continually Rise With The Decrease In Nifty 50 Value, As ATR Doesn’t Provide Any Information About The Direction Of Market, The Possible Direction Can Be Known By Using Any Other Directional Indicator (Super Trend, Moving Average, Macd Etc.) With ATR And Trade Can Be Done Accordingly.
In Phase 2:
Value Of ATR Decline From 180 To 120 Level, This Is The Indication Of The Sideways Market Any Directional Indicator That Has Been Used During This Period Will Probably Give False Signal Majority Of Time, So In Such Time Use Of Any Kind Of Lagging Indicator Must Be Avoided for trading purpose.
Let’s Look At The Example of The Copper
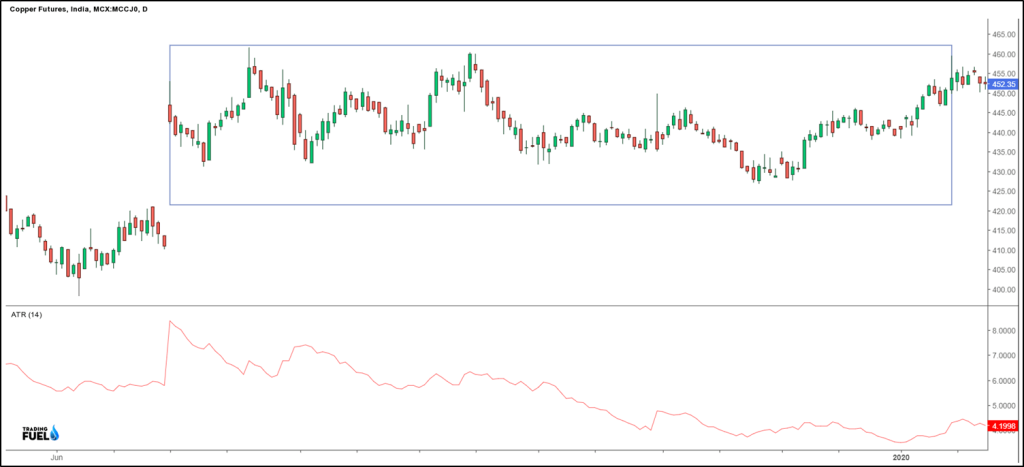
Here also the value of the ATR decline, during which the price of the copper remains in a sideways direction.
Limitations of ATR Indicator:
- ATR value is subjective, as in the case of another indicator like RSI in which there is an oversold(30) and brought zone (70) such clear number are not in ATR which tell us about when the market will be in sideways or at which level market will be in trending phase instead ATR value always be compared against past reading to get a feel of a trend reversal
- It also doesn’t provide any information about the direction of the trend , it has to be used in combination with another directional indicator
Amibroker Code for ATR:
periods = Param( "Periods", 15, 1, 200, 1 );
Plot( ATR(periods), _DEFAULT_NAME(), ParamColor( "Color", colorCycle ), ParamStyle("Style") );
By, Your Trading Fuel