
There are many schools exist for education of technical analysis of stocks. Technical analysis is the analysis of volume and price. It also deals with the correct use of these factors. It transforms the rules and bottom lines for profit and loss.
Technical analysis uses past data available in the form of charts and graphs. Tools such as different type of charts and trading volume are available. The strategy refers to the study of stock’s movements. Depending on the past behavior, we assume the future behavior of the stocks.
PART 1
Introduction to Technical Analysis of Stocks
Technical analysis is utilized by huge number of experts. Major aspect of financial markets & mathematics and statistics and their techniques are fastest taking over. The fundamentals of technical analysis are easy to learn. Once you get the knowledge of technical analysis, you can easily understand how to do technical analysis of stocks.
What is Technical Analysis of Stock?
- Technical analysis isan art and science of predicting future prices based on an examination of the past price movement.
- In Technical analysis we analyse current demand and supply of commodities, stock, indices, futures, or any tradable instrument.
- Stock information like price, volume is placed on the chart and applying various patterns and indicators to assess the long term price movement and short term price movement.
- The time frame in which technical analysis is applied may range form intraday, daily, weekly, or monthly price data to years
The time frame in which technical analysis is applied may range form intraday, daily, weekly, or monthly price data to years
The Basis of Technical Analysis
1. Price Movements Are Not Random
- Hundreds of years of price chart have shown us one basic truth “price moves in trend”.
- If the price were always random it would be extremely difficult to make money using technical analysis.
- Technical analysis can be applied to many different time frames forshort term and long term trends.
2. What Is More Important Than Why
- As a retail trader, we are at the end chain of the information, we receive the information at last after the insider trader and big fund manager.
- Till the information has reached us its effect on the price is already discounted.
- A technical analyst is mainly concern with the current price and history of price movements.
- Price is a result of a fight between supply and demand.
Fundamental of Technical Analysis
Technical analysis is based on three assumption
1. The Market Discount Everything
- Technical analysis is criticized for considering prices and ignoring the fundamental analysis of the company etc.
- A stock price reflects everything that has or could affect the company including, fundamental factors.
- The market is driven by mass psychology.
- It is believed that company fundamentals along with broader change economic factors and market psychology are all priced into the stock.
2. Price Move In Trend
- Trade with the trend is a basic login behind technical analysis.
- Once a trend has been established, the future price movement is more likely to be in the same direction as the trend.
3. History Tends To Repeat Itself
- People have been using charts and patterns for several decades which is evidence of repeating price patterns.
- The repeating nature of price movement is attributed to market psychology.
- Mass participants tend to provide a consistent reaction to similar market conditions over time.
- Technical analysis uses a chart pattern to analyse market movements and understand trends.
What is The Use of Technical Analysis in Stock?
- Identifying Trend
The trend is the direction of the market, in technical analysis trends are identified by trend line connecting the high and lows form by price during it move in a trend, or by using a technical indicator such as moving average 200 which defines the long term trend in the market. Trading in the direction of the trend is one of the most popular strategy but for that we have to know the trend of a stock.
- Movement
Movement of the stock indicates the speed of price change in the stock.momentum shows the rate of change of price over a defined period helps the trader to define the strength of the move.stocks having lower momentum are dull stock while stocks having higher momentum are preferred for intraday trading.
- Entry
Entry point refers to the price at which a trader in punching buy or sell order, in trading timing an entry is everything, price alone cant help in timing but the technical analysis does, it guides us through different support and resistance value
- Reduce loss
It allows us to minimize the loss, by properly knowing the nearby support and resistance zone we can place our stop-loss order at the right price so that if we are wrong in our analysis our stop loss will prevent the dropdown in our capital.
- Target
There is a saying in the market “knowing when to exit is more important than then when to entry”, so before entering a trade it is more important for you to define your exit level in advance.
- False Trade
It prevents the false trade, technicals of a stock helps us to locate the support and resistance zone, so by understating the zone in which the price is, you can trade accordingly or at least we will not short a share near a support zone, or buy a share near a resistance. A wrong trade not only causes you to lose in the capital but you can face emotional pain, you can become irrational in your decision which causes you more loss.
PART 2
How Technical Analysis of Stock is Done?
There are n number of method, theory, and indicator available in technical analysis which can help in analyzing the strength and direction of the move. In the below example we will analyze the chart of reliance industry using combination of price action theory, dow theory, trendlineand fibonacciretracement indicator.
1. Monthly Chart of Reliance
- Below is the logarithmic chart of reliance industries in a monthly time frame.
- Reliance made low of 867.25, above the high of 2008, and bounce form that level as the high of 2008 act as support to the current price.
- The current candle in the monthly time frame is not completed but we can see the selling pressure coming from the top of December.
- As the price is in the prior resistance zone form by the high of December, we can expect a major or minor correction in trend.
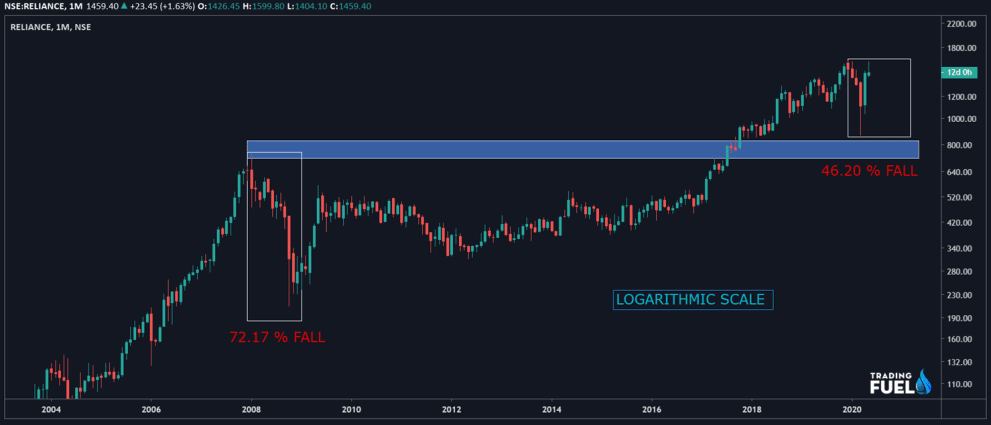
- Arithmetic Chart
- Here we did not use the arithmetic chart because in analyzing the larger time frame log scale is more accurate.
- In the above log scale chart you can see that current correction is much shorter than the 2008 correction.
- But If you use an arithmetic chart in a longer time frame As shown in the example below, you can see they fail to give the true picture.
- Here in the chart the current fall of 46% looks deeper than the 2008 chart.
- Such problems do not occur in a weekly, daily, short time frame.

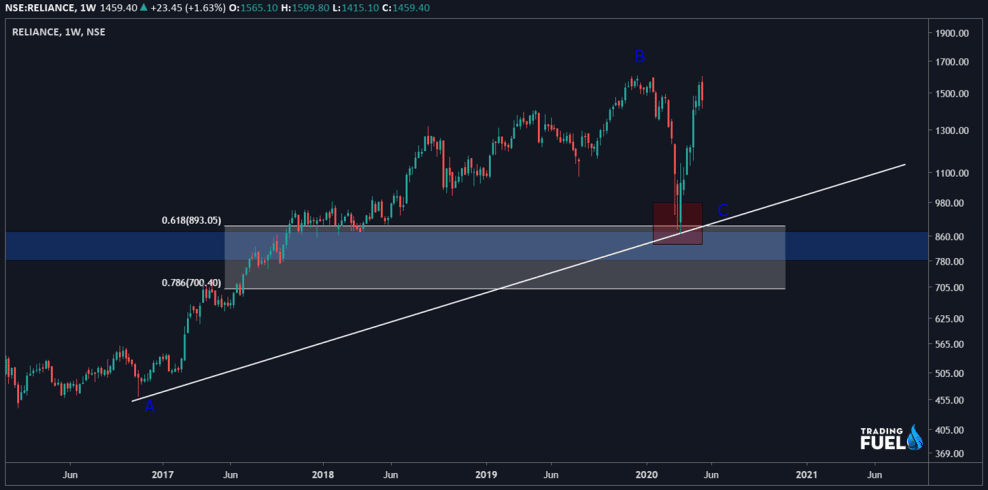
2. Weekly Chart of Reliance
- Below is a weekly chart of reliance industries.
- Point A(460) is a swing low and point B(1604) is swing high of the uptrend,61.8% to 78.6% retracement of this move lies between the price range of 893-700.
- 61.8% retracement is just above the monthly support zone(dark blue zone), which further indicated that the downtrend may be stopped at this region C which is a confluence zone.
- AC point now forms a trend line (white line)which will act as a dynamic support level for price in the future and we can expect a bounce from this trend line.
- If this trend line is broken with heavy volume then any retest to trend line will provide us good shorting opportunities.
- We will analyze this bounce from C in a lower time frame.
3. Daily Chart of Reliance
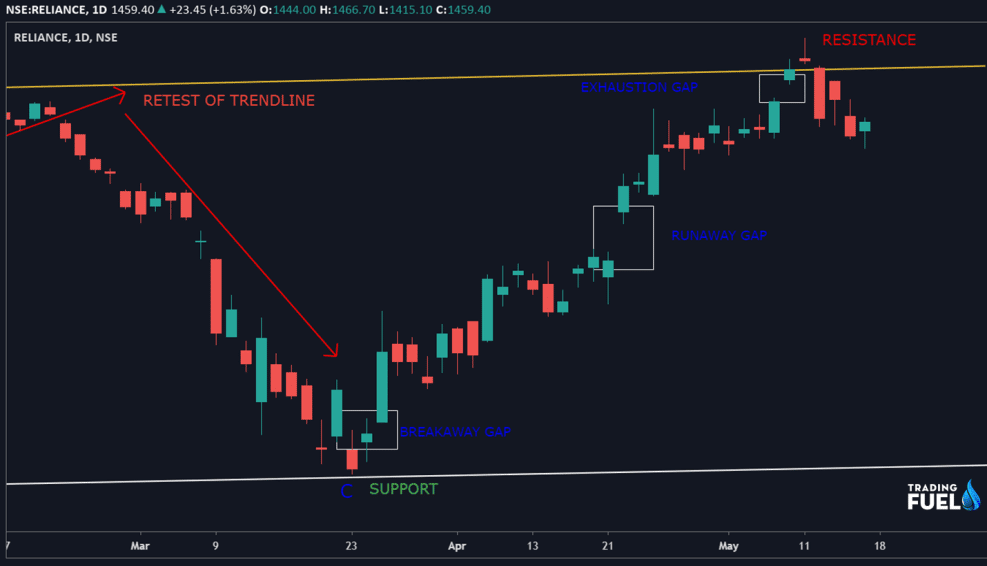
- In the daily time frame reliance industry after forming a high at 1677 in December and we can see a decline after that.
- It breaks the resistance (yellow trend line) on 18 Nov,2019 but latter that trend line is also broken on 28 Jan 2020.
- Now after the break out of the trend line, it will act as a resistance to price.
- Price Then Retest The Trend Line And Fallen Sharply Up To The Level Of 876 Point C.
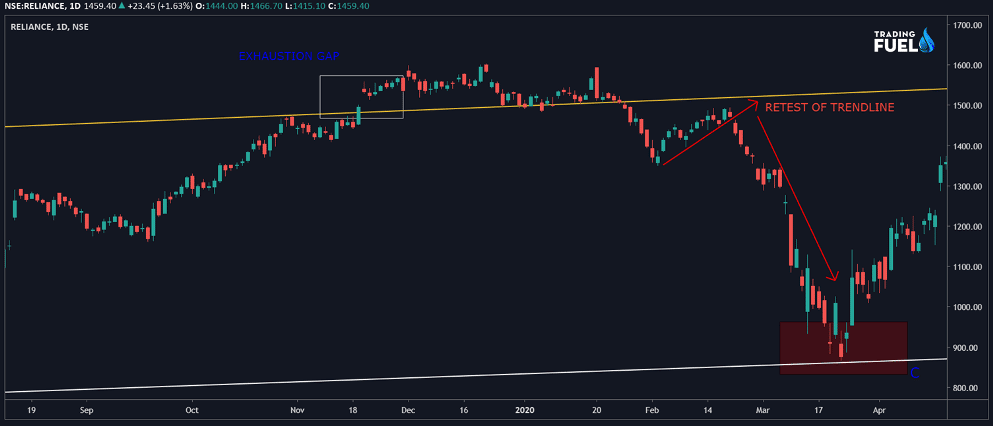
- From point c price bounced up to the previous resistance zone of the trend line(yellow line).
- It form exhaustion gap near the trend line and a shooting star candle both are bearish sign.
- Next-day share gaped down and the trend line is broken, as the price is near the resistance zone in daily we can expect a downside move-in reliance.
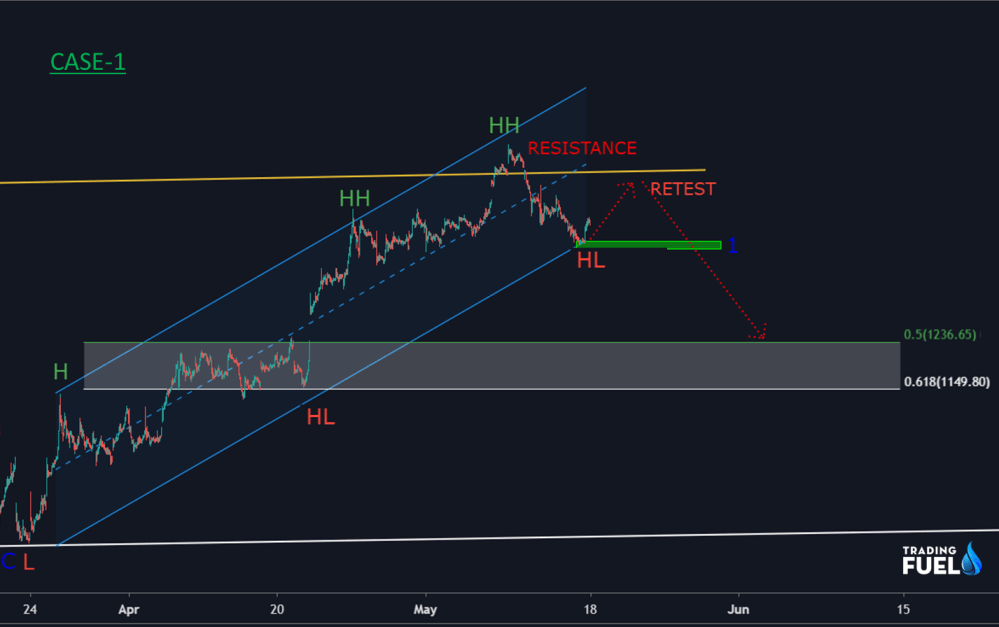
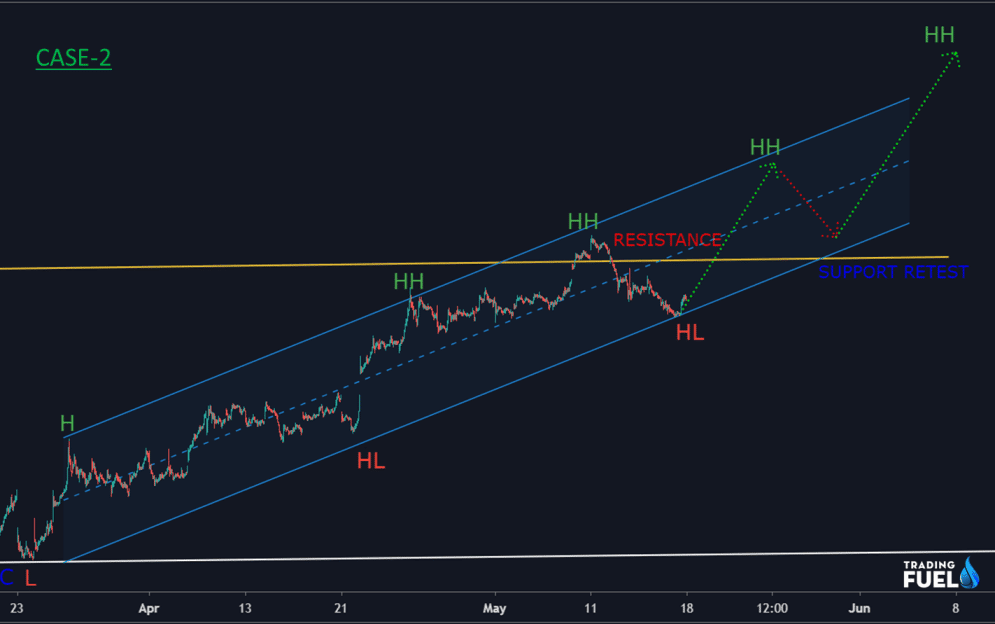
4. Intraday Chart of Reliance
- We will look at the bounce from point C in a 15-minute time frame.
- Price is in an uptrend forming higher high and higher low.
- It seems that the price has moved in a channel.
- After breaking the trending line (yellow line) price has reached the lower end of the channel forming a higher low.
- There are two possibilities form here we will look at them separately.

Case-1:
- If the higher low(point-1) is broken after the retest of the trend line we can expect a major correction in price.
- 50%-61.8% (1236-1146) retracement of the up move from point c is shown in the figure.
- 1236-1146 are the next support zone if the price breaks the higher low (1).
Case-2:
- If The Higher Low (Point-1) Is Not Broken And Reliance can Form A New High.
- Then Any Decline Form This New High Near The Support Zone Will Give Buy Entry.
- Stoploss Could Be Placed Below The Support Level Or At The Nearest Swing Low(Ll).
- We, Will, Assume That The Price Is Goona Remain Inside The Channel.
Strength of The Technical Analysis
- Technical analysis has a universal application. It can be applied to any financial instrument stock, future, and commodities, fixed income securities, forex, etc.
- The market is prone to sudden unexpected price movement, but their hints usually develop before any significant price move.
- It provide us support and resistance level, these are the trading range in which the price move for an extended period.
- When price moves out of the trading range, it signals that either supply or demand has started to get to the upper hand.
Weakness of The Technical Analysis
- Technical analysis is not a hardcore science it is subjective and your personal bias can be reflected in the analysis.
- Technical analysis is a combination of science and art, may time two technicians will look at the same chart and see two different patterns.
- Technical analysis can give a dealy signal, by the time the trend has been identified a substantial move has already taken place.
- Too many details, even after a new trend has been identified there is always another important level close at hand.
How To Do Top-Down Technical Analysis?
- In top-down analysis, each analyst will analyze longterm and short term charts.
- You can start with the analysis index if the index were considered to be in a bullish market, then we will analyze the sectors which are in a bullish trend too.
- Then we will narrow down our list to 3-5 industrial group.
- Individual stock selection can be done, with a selection of 10-20 stock chart form each industry.
- The selection of 3-5 most promising stock can be from each group.
- The number of stock left will depend on the strictness of the criteria set forth.
- We should narrow our final list up to 10 shares and then select the best 5 share amongst them.
PART 3
Important of Technical Analysis
Many factors impact the movement of the stocks. These factors ratios of earnings to price and new products. The economic cycle is also a major factor. The analysis generally tracks the patterns that are repetitive. These patterns predict future trends too. Hence, the very first importance lies in predictions. Market forecasts help investors to do a smart trade. The acts of buying and selling happen on the basis of emotions of investors. Investors and traders behave in a certain manner under some conditions out of fear and greed. This pattern of behavior results in certain market conditions. Study of this pattern is important. It helps in knowing the possibilities in share market.
Technical Analysis of Stocks
Technical Analysis says that the price of stocks gives all the required information, if you have sufficient knowledge of technical analysis then there is no need to do a deeper fundamental analysis of the company or industry. The way of analysis is based on the concept that market discount everything. This indicates that the actual price is the reflection of everything which is known to the market that could affect it.
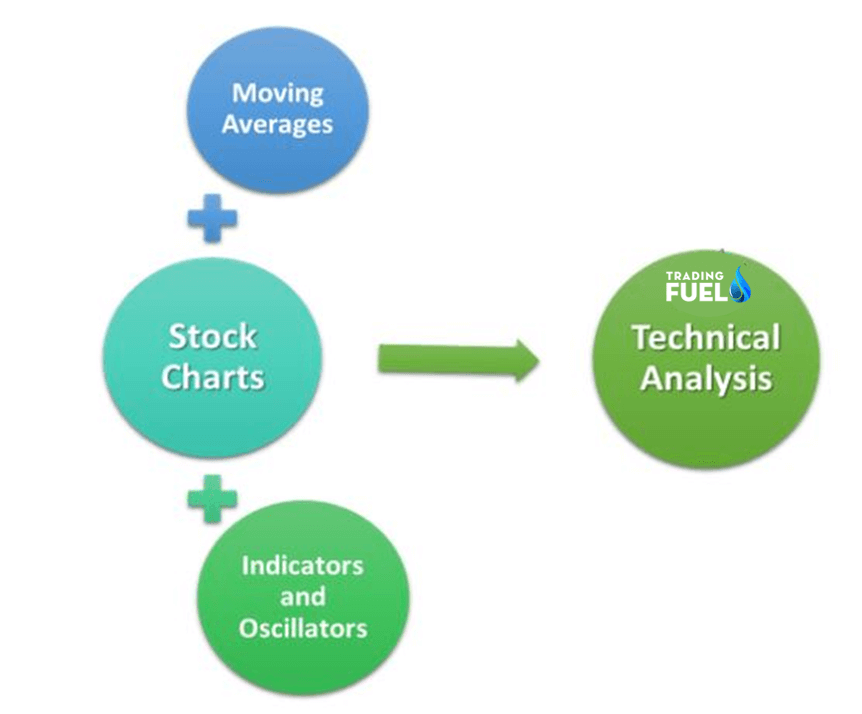
To perform this kind of analysis, technical analysts make us of
- Stock Chats (shows the price and volume trends)
- Moving Averages (Simple or Exponential)
- Other momentum indicators
One of the most important use of technical analysis of stock is that, with the help of historical price and data you can do back-testing to test your different trading strategies that are purely based on technical parameters.
Technical analysis is generally short-term in nature. It is usually preferred by traders who are interested in small period investments ranging from hours to even weeks. Now let’s take a look on methods of technical analysis.
Methods of Technical Analysis of Stocks
To perform technical analysis, you need to assume that there is some relationship between historical chart patterns and future stock price. In the technical analysis you need to keep three things in your mind that are
- Stock prices follows trends
- Stock charts moves in a hypothetical pattern and it tend to repeat themselves
- Market prices throw back all the information about a stock
Method of technical analysis is based on these assumptions. In this method there are three main aspects that you must consider during the technical analysis.
1. Stock Charts
Technical analysis is basically the prediction of the future movement of the stocks and it is based on the past performance of the stocks. Charts are the platform that include the historical data which help traders to interpret the story of a stock’s price action. The common types of charts are candlestick, line and bar charts.
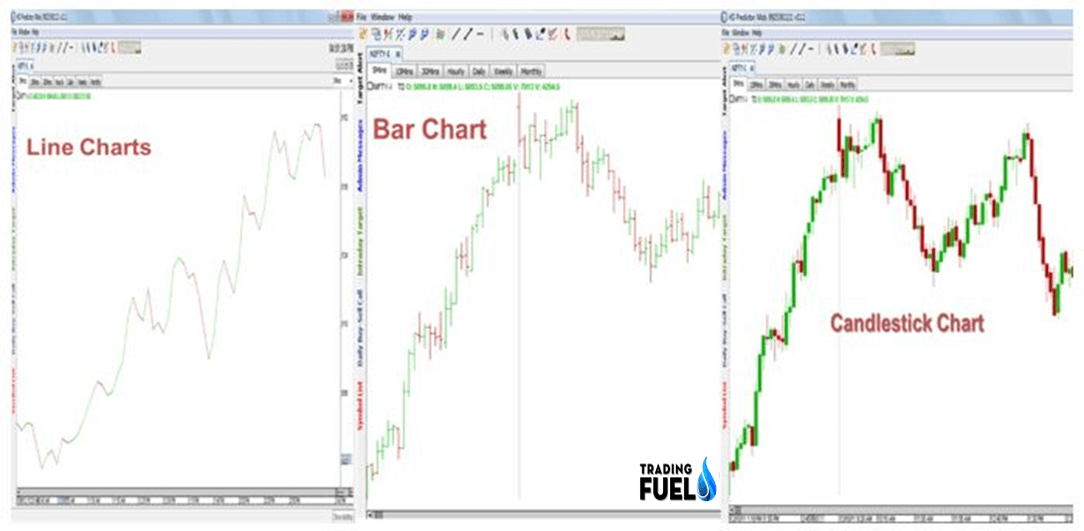
Chart plot the prices with respect to time. The time interval of the chart can be specified through the settings. Candlestick chart is most commonly used by the trades. In this type of chart, the different time frame is available from 1 minute to daily, weekly and monthly. Depends on the different trading strategy, traders use the different time frames. To get detailed knowledge about stock charts.
2. Moving Averages
Moving Averages are one of the oldest and most commonly used technical indicator. It is calculated to remove sharp, frequent fluctuations in a stock chart. Moving Averages are based on events that have already occurred in the market. There are 3 types of moving averages – simple, Weighted, or exponential and it is a lagging indicator.
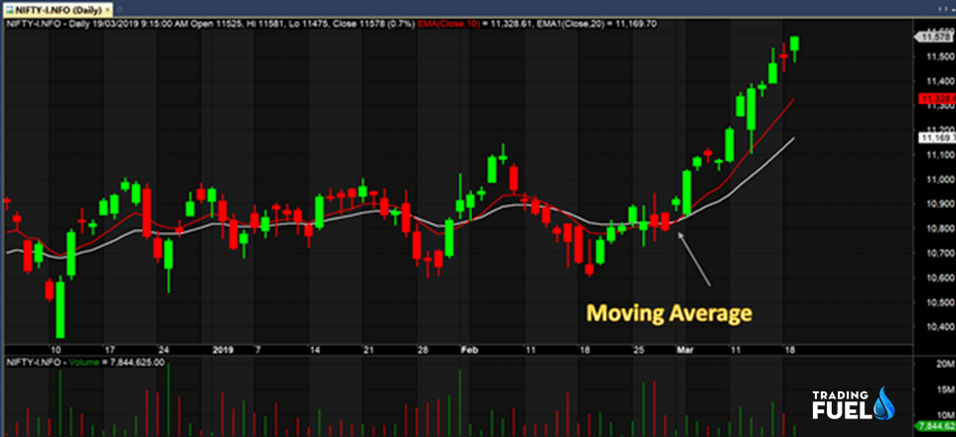
Moving averages are used by most of the traders to find the trend, to know the reversal of the trend. It is also, useful for finding right stop loss.
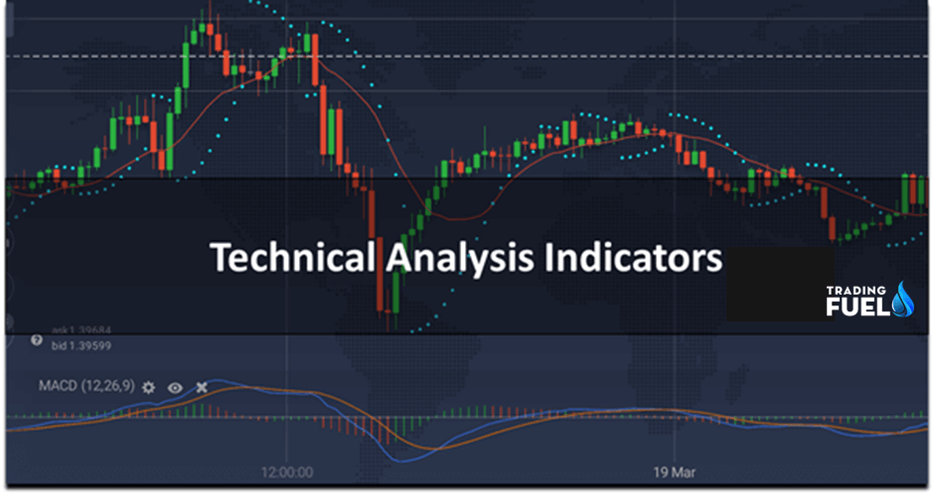
3. Technical Indicators
Technical indicators are mathematical calculations based on the price, volume. With the help of indicators traders can predict the future price movement. Indicators are divided into two main types, that are – Momentum Indicators and Price Indicators.
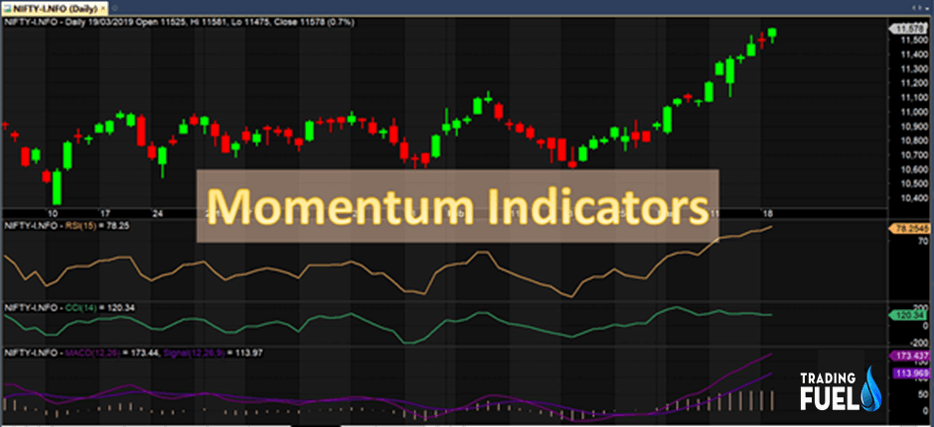
4. Momentum Indicators
Momentum Indicator measure the momentum of stocks. Generally, these indicators show overbought and overbought signals. These indicators are useful for traders to find right entry and right exits. These indicators are plotted below a price chart. Stochastic, Relative strength index (RSI) and commonly Channel Index (CCI) are widely used leading momentum indicators by the traders.
5. Price Indicators
Indicators which are based on price and generates information like trends, support and resistance are price indicators. Technical indicator uses the same scale as prices are plotted over top of the price on a stock chart. Moving averages, Bollinger bands are widely used indicators.

combination of price and momentum indicators can help to generate more accurate result. Most of traders combine different price and momentum indicators as per their strategy and the right mix of technical indicators can give high probability signals.
Not only technical indicators, there are basic tools which also helps traders to generate converting signals that improve the probability of a direction price move. These tools are as follow.
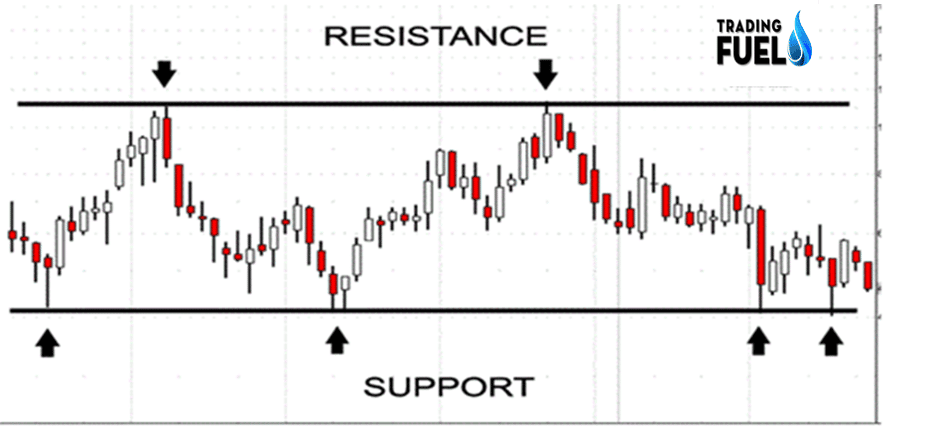
6. Support and Resistance
By analyzing charts, traders can see certain price levels that tend to prevent prices from falling any further before rising back up again – it is known as support level. Price levels that continue to provide rejection and it cause price to fall back down again after testing – it is known as resistance levels. Support and resistance are a price level from where a trend can be expected to pause due to a concentration of demand.
7. Stock Volume
Volume measures the total number of shares traded for a specified period of time. It is used as a measure of interest that present significant price action. High volume indicates a breakout or breakdown accompanied by a sustaining trending activity that triggers a Breakout or breakdown accompanied by a sustaining trend in prices. Breakout result in higher trending prices and breakdowns result in lower trending prices.

8. Trends
Trends gives the current direction of Share prices. When stock price continues to rise higher, it is considered to be in an uptrend and vice versa for a downtrend. Uptrend indicates increases demand for shares, as buyers are willing to pay higher prices as supply decreases. By connecting the various high and low points on a chart, you can generate trend lines that pinpoint support/resistance and direction of stock prices. Also, Indicator such as moving averages help traders to identify the trend.
Benefits of Technical Analysis
- Technical analysis helps to predict the future movement of stock market.
- Historical chart patterns and other technical tools, can help to predict the major movement in the stock market.
- With the help of technical analysis, traders can predict the major fall that about the come in future.
- Tracking the Trends
As said above, the biggest benefit of TA is a prediction. The main use as well advantage is forecasting market trends.
- Right Timing Predictions
Right decision at the right time plays an important role in trading. With the help of charts, traders predict the right entry and exit points.
- Affordable and Faster
The analytical tools help us to understand the future trends faster. We can study the movements of the market even in the case of a trend reversal. The technical analysis is quite affordable. Charting software is less expensive.
- Large Multi-Purpose Data
Tools or charts increase your access to the volume data. A brief chart or diagram will inform you a huge data. The analysis is useful in long term investment, swing trading, and short term trading. It gives lots of information like trends, resistance, and market volatility. It also shows you investor’s behavior and trader’s psychology.
Technical analysis helps traders to minimize the stop loss with the help of different strategies. For intraday trading, technical analysis is more relevant for professional traders as compare to fundamental analysis.
Reliability of Technical Analysis of Stocks
There is a vast scope to trade well with the smart use of charts. A skill of reading the charts can do wonders. The charts use the proven factors in innovative ways. Forecasting and right enter and exit timings are major.Early signals are also the main benefits. The modern day technical analysis is more reliable. It is smart due to the use of computers and internet.
Conclusion:
In this article we have discussed the technical analysis, and its basic, fundamentals, limitation, advantage, and a complete analysis of reliance industries stock. There are other forms of technical analysis other then what we applied in reliance industries stock each having their advantage and disadvantage. A proper selection of a technical analysis system is very important that has a higher success rate, for that, you must find an experienced person to guide you or you can also attain a training analysis course to help you understand in detail the different methods of analysis from a prominent institute.
By Trading Fuel