What is Volatility in The Stock Market?: If you are a regular trader in the stock market or if you are averse to what the stock market is, you might have come across the term “volatility”.
This term is used to determine the risk or uncertainty concerning how the stock market will move.
What is volatility?
- Volatility is the rate at which the price of the stock will increase or decrease over a particular period of time.
- Higher stock volatility will imply higher risk.
- This will help the investor estimate the fluctuations that might happen in the future in the market.
What is volatility in the stock market?
- Volatility in the stock market is the rate at which the price of the stock will increase or decrease for a given set of returns.
- In simple terms, volatility is the gauge of how fast the value of the stock or the market index will move.
- The same is measured by either the standard deviation or the variance.
- This will suggest that the higher standard deviation value will suggest that the prices are spread across a very wide spectrum.
- Conversely, a low standard deviation value will indicate that the prices are close to a narrow range.
- In the stock market, rapid price fluctuation in either direction is considered to be volatile.
- In most cases, a surge or dive of a mere 1% in the market index will classify it as a volatile market.
Also Read:What is Technical Analysis of Stocks?
What will drive stock price volatility?
There are many things that will drive stock prices.
They are the following:
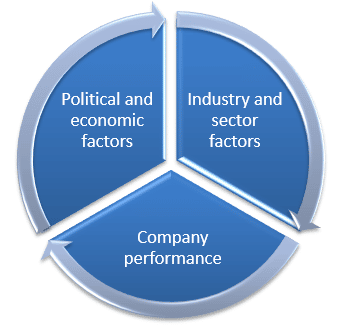
#1. Political and economic factors:
- The government will play a major role in regulating the industries.
- They can also impact an economy when they make decisions on trade agreements, policies, and legislation.
- Each and every single thing, from speeches to elections, will impact the stock market as well as the thought process of investors.
- Economic data will also play a major role.
- When the economy is performing well, the market will react positively.
- Monthly job reports, inflation data, GDP calculations, and consumer spending data will also impact the performance of the market.
#2. Industry and sector performance:
- Specific events will cause volatility within a particular industry or sector.
- The same is the case with government regulations.
- When there is more government regulation, then there are high chances for the stock prices to fall.
#3. Company performance:
- Positive news about the company will in turn lead the investor to go for the company.
- This will in turn increase the stock price of the company.
- The reverse is the case when there is negative news about the company.
Historical volatility:
- “Historical volatility” will refer to the measurement of the volatility over a sustained period based on the historical movements in returns or prices.
- Because of its reliance on scientific measures, this concept is also known as statistical volatility.
Calculation of historical volatility:
- This measure of dispersion is based on past as well as concrete data.
- The institutional investors will be following the rule of thumb while calculating the same.
Let us understand this with the help of an example:
Here is the price of Stock A for 5 weeks:
| Week 1 | 130 |
| Week 2 | 110 |
| Week 3 | 120 |
| Week 4 | 100 |
| Week 5 | 140 |
Step 1: Mean calculation:
Mean= (130+110+120+100+140)/5 = 600/5 = 120
Step 2: The difference between Mean value and each component in the database:
Now we are required to calculate the deviation between 120 and the rest of the elements in that particular dataset.
- 130-120= 10
- 110-120= – 10
- 120-120= 0
- 100-120 = -20
- 140-120= 20
Step 3: Adding the deviations after squaring them:
[120+ (-10)2 + 0 + (-20)2 +202]= 1000
Step 4: Divide the squared deviation by the total number of elements in the dataset to calculate the variance:
- 2 = 1000/5 = 200.
Hence, the standard deviation of Stock A will be reached by square rooting this value of 200.
Thus, the standard deviation of Stock A is 14.1421.
Must Know:What is Index Trading?
Different measures of volatility:
Apart from standard deviation and variance, there are other means as well through which volatility can be measured.
They are as follows:
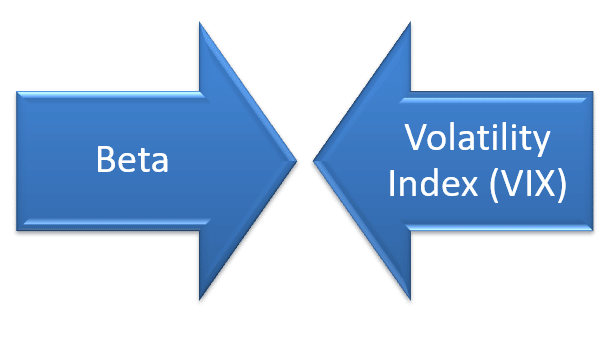
#1. Beta:
- The beta will show the relationship between the value of stocks and their relevant market index.
- Thus, it is a concrete representation of stock volatility.
- It will also represent the approximate volatility in returns of the securities against that of the relevant benchmark index.
For example,if a particular stock shows a beta value of 1.5 and its relevant benchmark index is the Nifty 50, then this will denote that for a 100% change in the Nifty 50 index, that particular stock will move 150% in value.- High beta = higher correlation with the index = higher volatility.
#2. Volatility Index (VIX):
- The VIX index is based on investor predictions about the movement of specific securities or the broader market.
- VIX was developed by the Chicago Board of Options Exchange.
- It takes into account the opinion of the investor.
- High VIX = volatile and risky market and vice versa.
Taking a long-term view in volatility is important:
- Investors who are looking for long-term profit are not much concerned about the volatility in the market.
- Here are the main reasons that need to be considered while having a long-term strategy:

#1. Timing the market is difficult:
- It is impossible to predict exactly where the top or bottom of the market will be.
- When investors are timing the market, the only thing they are doing is buying high and selling low.
- The bad timing will cause you to incur more losses even during volatile times.
#2. Best days have a big impact:
- History states that the stock market will correct after three downward waves.
- This will mean that the investors who exit may miss the best recovery days as well as the most attractive buying opportunities.
- This can also have a significant impact on long-term returns.
#3. Good companies need time:
- Quality and good companies with strong fundamentals will do better when the economic conditions slow down or simply when the market volatility increases.
- These companies often come out stronger when they are better off from the storm.
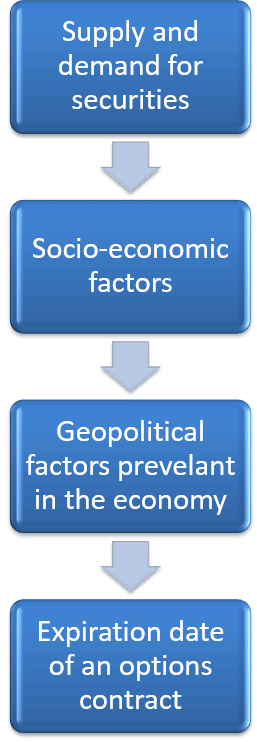
Factors that affect volatility:
The following are the main factors that affect the volatility in the market:
Conclusion:
We hope that the above blog gives you clarity about the volatility in the market.
Frequently Asked Questions (FAQs):
Q#1) What are the types of volatility?
Answer: There are basically two types of volatility, such as historical volatility and implied volatility.
Q#2) What is implied volatility?
Answer: It refers to the predicted movement of returns of securities or the market index based on supply and demand and other relevant factors.
Q#3) What is meant by “market volatility”?
Answer: This denotes the dispersion witnessed in the returns of a market index around its mean or moving average.
Q#4) What is another word for volatility?
Answer: The other word for volatility is unstable, or unsettled.
Q#5) What is the opposite of a volatile market?
Answer: The opposite of a volatile market is a stable or fixed market.
About Us:
Trading Fuel is our website for blogs where we provide you with knowledge about finance, economics, the stock market, as well as intraday trading. Stay tuned with us for more such blogs.