How to Trade Reversal with A-B-C Pattern? (Trading Fuel | Research Lab):
1. What is the foundation of the A-B-C Reversal Pattern?
- ABC Reversal Pattern is linked with the principles of Dow Theory.
- In Dow Theory, Charles Dow has explained that if the price failed to break the earlier high, and form a lower high, such a pattern is considered bearish.
- The base for our analysis is the same principle, but we are going to discuss in detail its implication, characteristic of volume, and behaviours of price, and how to trade with A-B-C Reversal Pattern.
2. Identifying the A-B-C Reversal Pattern Trading Setup:
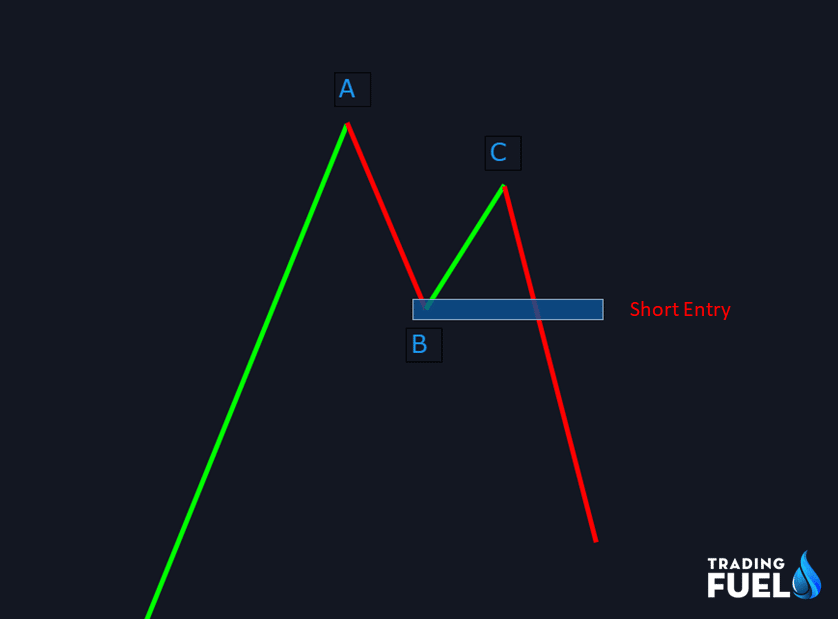
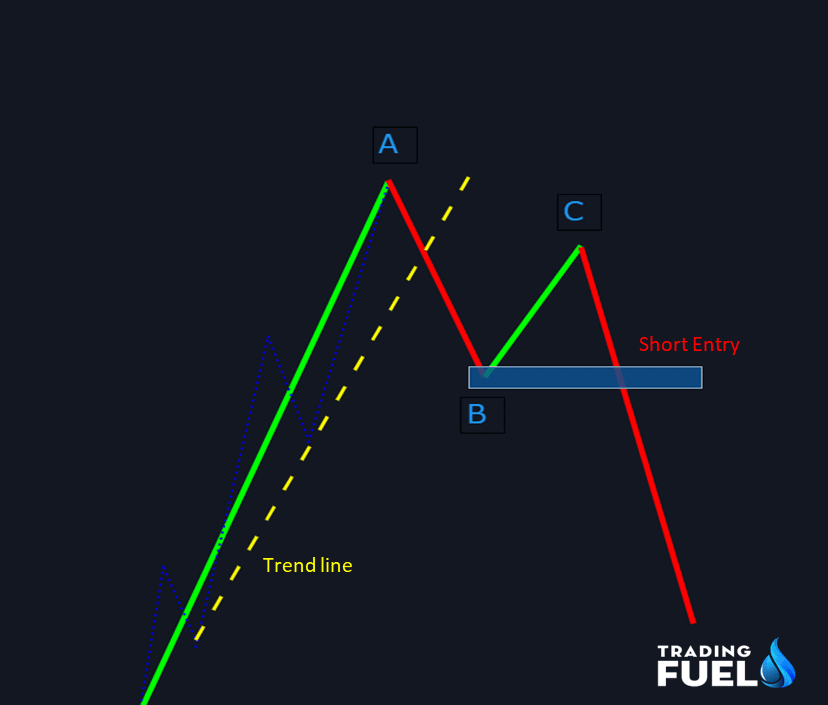
In the image you can see the basic form of ABC Reversal Pattern; we have shown the formation of ABC in a bearish scenario.
Must Know: Elliott Wave Theory
- Here the dotted yellow line is a trend line of the previous uptrend.
- We use a trend line break for double confirmation of the bearishness in the market.
- The trend line is formed by joining the swing lows of the uptrend shown by the dotted blue line.
This pattern has four key points:
i. Before point A:
- The share starts to lose its momentum and showing the sign of exhaustion in price.
- Most of the time before forming a top price show parabolic expansion move, which is indicating weakness in the trend.
- A decrease in volume is the 1st indication that top might be near as the rise in the price is not supported by the increase in volume.
- The volume also starting to lose its strength and you can observe a decrease in the volume momentum in the chart.
ii. At point A:
- Point A is the top of the trend.
- That has formed after a strong bullish momentum.
- Up to this point, the price has moved too far and correction in the trend is imminent.
- The decline from point A is supported by heavy volume, indicating major players are adding a short position.
iii. Point B:
- After a rally in price, price usually retraces up to point B and bounce from that level.
- Most probably price bounce from Fibonacci levels 23.6%, 32.2%, or 61.8%.
- These Fibonacci levels will act as a support and price bounce from these levels.
- The bounce came without any significant volume confirming that the bounce is a “corrective rise” rather than a continuation of the previous uptrend.
- If point B is breaking a major trend line which is form by the swing low of the previous uptrend, it is adding confirmation to our bearish view.
iv. Point C:
- Point C is lower, creating a lower high formation.
- As point C is lower than the top, it is a clear sign of weakness.
- The price failed to break the high, point A.
- It is also common to see the price making a serious effort to continue the previous uptrend.
- The decline from point C is with heavy volume.
- Traders who are still holding a long position will likely close their long position as the low of point B is broken.
3. Entry Rules:
- Stop loss must be above point A.
- Entry a short trade after the price close below the low of point B.
- Exit can be done after you get a higher risk-to-reward ratio say (R: R) 3.
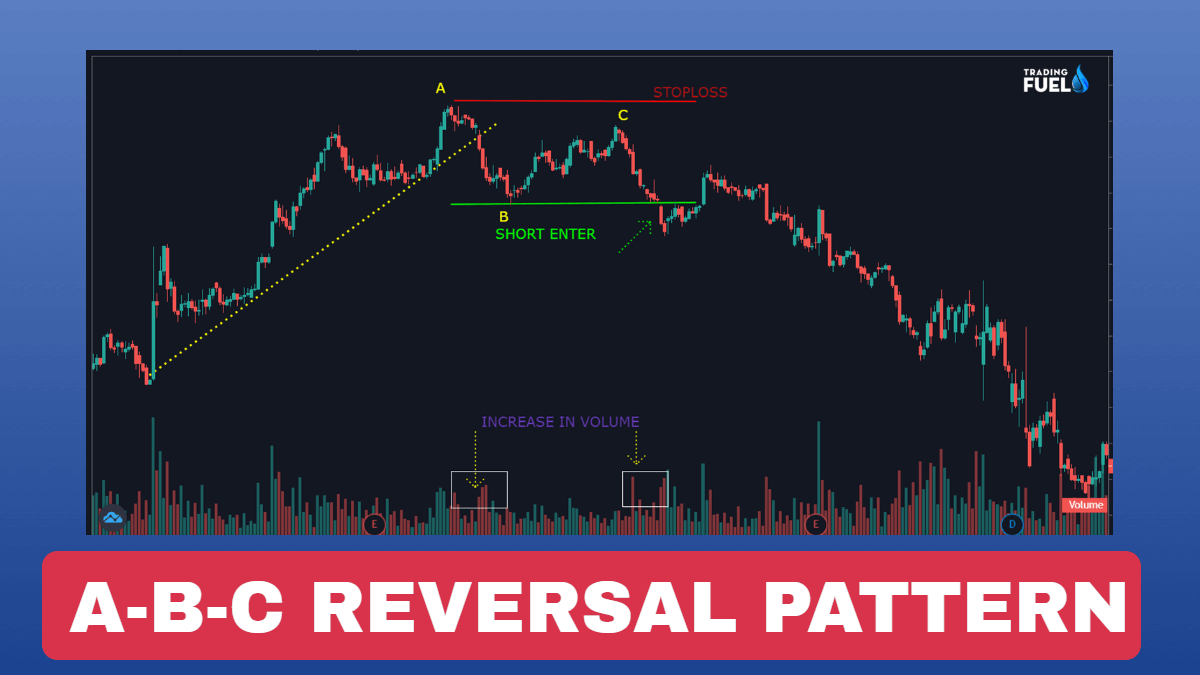
4. A-B-C Reversal Pattern Trading Example:
Let us see some examples of A-B-C setup for a clear understanding of how to apply it.
Bearish Example:
- The yellow dotted line is the trend line which was earlier giving support to price.
- The decline from point A is accompanied by heavy volume, indicating a possible reversal in trend may occur.
- After the trend line is broken market was struggling to go up.
- The market tries to resume the uptrend but failed at point C.
- After a candle close below the low of point B, we can enter a short position.
- Stop loss for this trade can be placed above point A,
Note: If the trend line is not broken, then what we are expecting to be a reversal in trend will be a minor pullback in price, after which the price will continue its uptrend.
5. How to Avoid a False Trade:
If you are having a second thoughts about your analysis, the direction of the trend, or its strength, it is better to use a confirmation signal to identify a possible false trade, for double confirmation you can use any study which you are currently using or you can apply other theory as shown below.
- Using divergence
- Volume analysis
- Multiple time frame analysis
- Using climactic volume to find exhaustion move
Out of these theories, we will discuss in detail about the divergence.
How can be a divergence used as a double confirmation?
Divergence:
- Divergence is when the price of a share is trending in a direction opposite to an indicator value, such as RSI, MACD, or other momentum indicators.
- Divergence in Price vs. Indicator gave a warning signal that there might be a possible reversal in the trend or the trend is losing its strength.
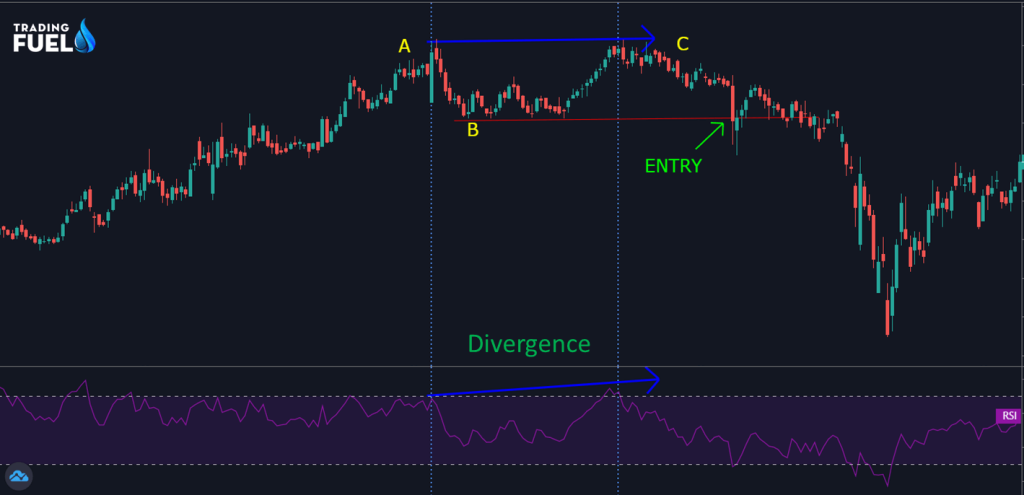
- Here we have to use RSI to see the divergence between price and momentum.
- Form the image it is clear that point A and point C are almost at the same price level.
- And the momentum of point C is slightly higher than that of point A, you can see this in the image by a purple line pointing in an upward direction.
- You can see a divergence between price and momentum marked by the purple arrow.
- Such divergence at the top is indicating either the trend is about to get reversed or it is losing its strength.
Conclusion:
ABC Reversal Trading Strategy is based on the Charles Dow principle, we have discussed the importance of volume in identifying a genuine price reversal, it is always better to use a double confirmation to filter out a false or weak trend. If you could spot price-breaking a trend line after a huge trend and with heavy volume, then you better keep such share in a watch list and see if they are forming an A-B-C reversal pattern. Such a setup will give you a higher risk-to-reward ratio to trade.
Contain & Image ©️ Copyright By, Trading Fuel || Research Lab