How to Spot Tradable Pull Back?
• In pullback trading, we enter after a retracement of the main trend.
• We assume, after retracement, the main trend will continue.
• We look for price rejection to confirm our entry.
• We are using the Keltner channel to identify tradable pullback.
Three Steps to Profit:
- We are using the Keltner channel to identify the main-trend and to find a pullback.
- We will look for a rejection of the price to confirm our entry.
- Stop loss and target can be placed with the help of ATR and price action.
As we are using the Keltner channel for the trading pullback, let us first study what is Keltner channel?
What Is Keltner Channel?
• A Keltner channel is a volatility based indicator it consists of three separate lines.
• Most of the price is remaining within the upper and lower band but when it breaks out the upper or lower band it signals a trend reversal or increases momentum in the current trend.
• In a sideways market price tend to oscillate between the upper and lower band, under such condition the upper band will act as resistance and the lower band will act as support.
• The angle at which the channel is placed is important, if the angle is upward we can assume the short term trend is up and if the angle is down we can assume the short term trend is down.

• The centreline: It is an exponential moving normal (EMA) of the price by default it is of 20-period.
• The upper band: It is normally set multiple of the average true range (ATR), is placed above the EMA.
• The lower band: It is normally set multiple of the ATR, is placed under the EMA.
The formula for Channel:
Middle line: The exponential moving average of 20-period.
Upper channel: EMA+2* ATR
Lower channel: EMA -2* ATR
ATR =average true range, ATR account the volatility of price, it is average of the true range of price for a definite period.
Step 1- Identify Pullback Trading
The main component of this system is the Keltner channel, it helps us to understand both trend strength and momentum.
• Proper selection of setting for Keltner channel is important, to cover price accurately.
• When the price moves outside this channel it is a sign of a trending market, whether the move is above or below the channel.
• After the price breach the channel and trading below or above the channel boundary, we will wait for a pullback in the price.
• Pullback trading must be occurring in the trigger range, trigger range is defined as 20 % to 80 % price range of Keltner channel
• Keltner channel setting we are using:
o 20-period EMA
o 2-times ATR multiple
Step 2- Trade Entry
• After the price came within the target range, wait for entry to get triggered.
• Entry can be done after a candlestick pattern form in the trigger range and confirming our view
• Example, Forming a pin bar with a long tail and close in the direction of the main trend.
Step 3- Stop Loss and Profit Target
• Stop loss must be at least 2.5 ATR away.
• In pullback, the stop loss is relatively wide, because pullback takes some time to develop.
• A profit target can be set according to risk to reward ratio, it is advisable to keep risk to reward ratio higher than 2.
Trading Rules for Long:
- Price surpasses the Keltner channel.
- Price pullback into the trigger range.
- Wait for the entry signal to go long.
Trading Rules for Short:
- Price surpasses the Keltner channel.
- Price pullback into the trigger range.
- Wait for the entry signal to go short.
Note: Wait for price to fall back with in the 20% – 80% range of channels within 4 to 15 price bars.
Pullback Trading Strategy Example
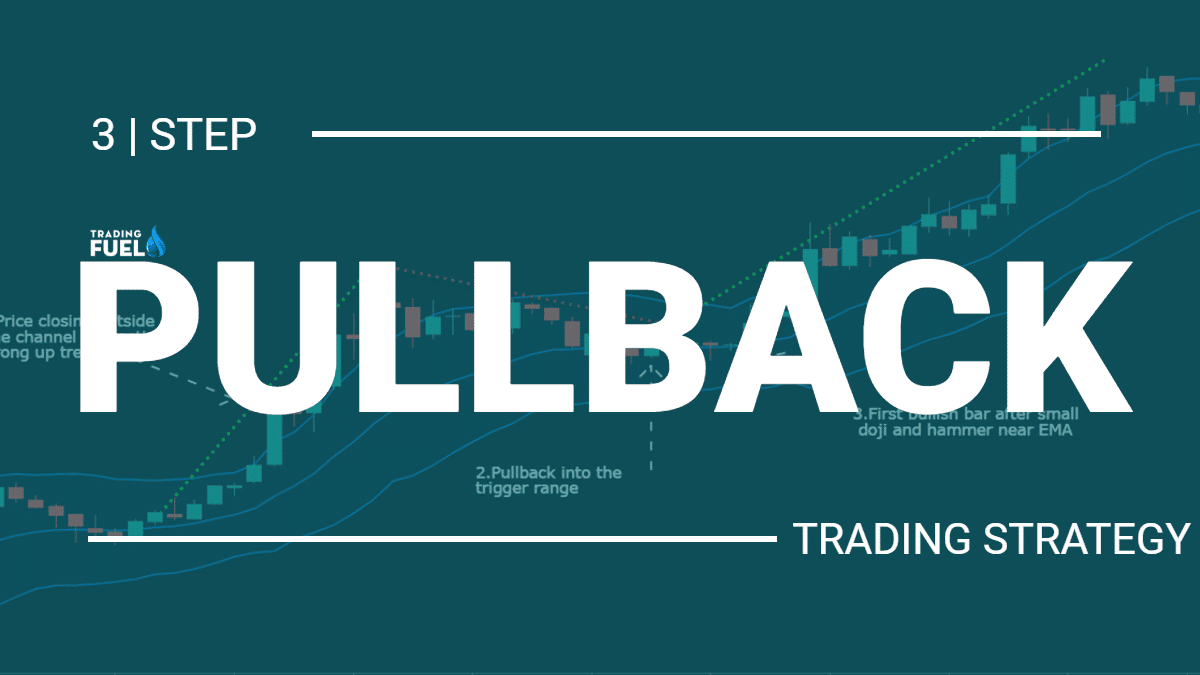
Winning Trade Example:

- These consecutive closes above the Keltner channel confirmed the bullish momentum.
- After a few bullish bars, the pullback comes with the target range and the market remains sideways within the range.
- The candle forming indecisive bar like hammer and doji after which bullish candle confirms the continuation of a trend and confirms the long entry.
Note: A bullish pin bar formation near the EMA line and 50% of the Keltner channel offer a good entry, as the risk-reward ration improves.
Losing Trade Example:

- These consecutive closes near the Keltner channel confirmed the bullish momentum.
- After a few bullish bars, the pullback comes with the target range and the market remains sideways within the range.
- The candle forming morning star formation nears the 50 % range of the channel and near EMA confirmation our bullish view.
- Entry can be done after bullish candle, but unfortunately, our stop loss would be hit in this case result in a losing trade.
Conclusion:
This strategy describes a method for trading pullbacks in a trending market however there’s adequate space for experimentation. For example, you can use a pin bar strategy for entering short in the market. It is helpful if we consider the number of bars into a pullback, it helps us to time market better and we can increase our accuracy. You can use any other method of technical analysis along with the Keltner channel for double confirmation or avoid false trades, but you must understand the Keltner channel pro and cons before using it with other studies.
Contain & Image ©️ Copyright By, Trading Fuel Research Lab