What is The Trend Line?
As we know horizontal line acts as a strong area of support and resistance. In the same way trend line also acts as dynamic support and resistance which are inclined at an angle, preferable at 45 angles.
Trend Lines are two types:
1. Uptrend Trend Line:
A sloping area on the chart showing an upward direction of the trend.
2. Down Trend Line:
A sloping area on the chart showing the downward direction of the trend.
Understanding the character of the trend line is very important while drawing the trend line.it has many hidden facts within its simplicity. You just need to draw one trend line to your chart and you see the trend, momentum, support/resistance, and entry timing.
How to draw a Trend Line?
Before understanding, trend line let us first understand the trend of the market.
An uptrend has a price movement consists of higher high and higher lows. When we are talking about uptrend we are referring to a trend line that uses the higher low levels.
A downtrend has a price movement that consists of a lower low and a lower high. When we are talking about a downtrend we are referring to a trend line that uses the lower high levels.
The drawing trend line in your chart is simple you need two-point (swing low or swing high) and draw a line in between them.
If we draw a trend line connecting a minimum of 2 higher lows we will have an upward trend line. The upward trend line act as a support and price tend to retrace to an upward trend line after a strong up move.
If we draw a trend line connecting a minimum of 2 lower high we will have a downtrend trend line. Downtrend trend line act as a resistance and price tend to retrace to a downtrend trend line after a strong down move.
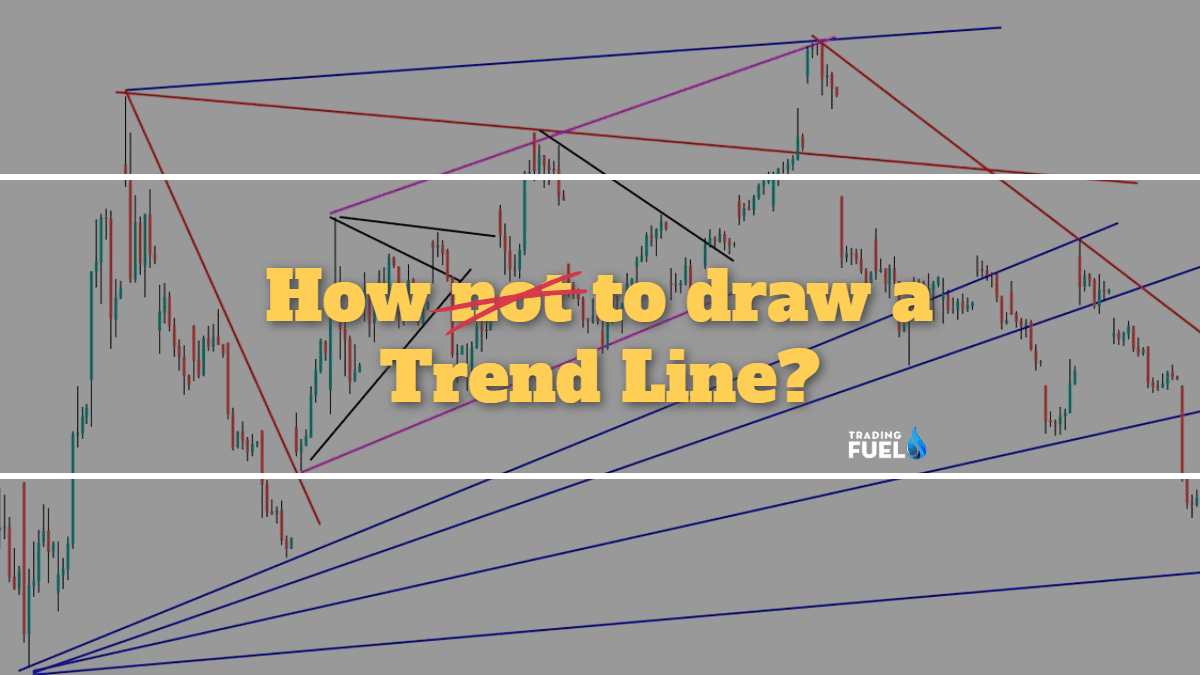
How not to draw a Trend Line?

If the trend line is incorrectly used it will cause sure loss. It important to know which trend line gives a better representation of the trend and which one is the false one.
Few tips to draw a correct Trend Line
- Focus only on the major swing points.
- Connect at least 2 major swing points.
- Adjust it so that you get the most number of touches.
- You can draw to parallel trend line to define the area on the chart.
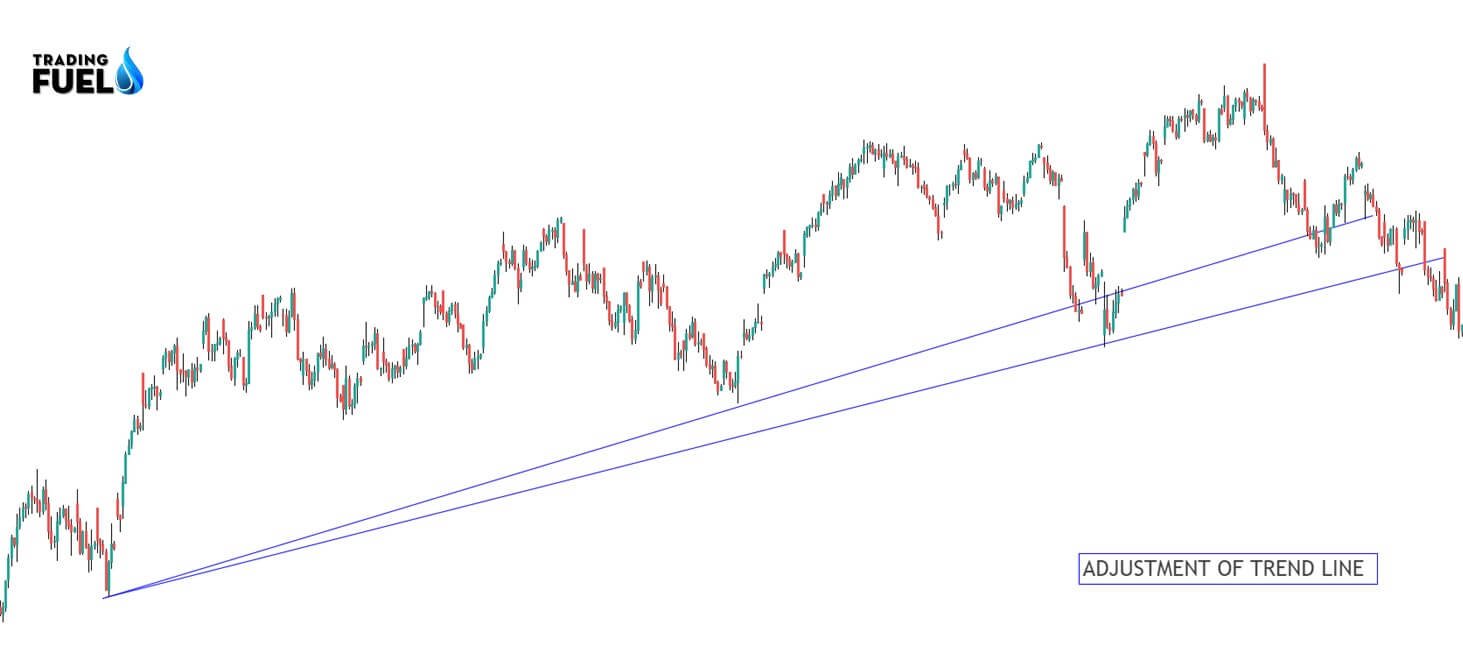
The trend line is a little different from the horizontal support and resistance line, you can easily draw a horizontal line and leave it. But the trend line needs adjustment.
Sometimes price breaks the trend line and closes outside the trend line and then again falls back within its trend line area.
Why using the Trend Line for Swing Trading?
The swing trader makes a profit from the market swing. One of the most widely used strategies for swing trading is buying on a pullback, as after a strong move price tends to retract back to the support level and we wait to enter at a retracement.
The trend line is all in one tool for swing trading. We are looking to trade after a retracement near the trend line.
The direction of the trend line represents the trend direction of the underlying stock. It tells us about the direction in which we will place a swing trade order.
The steepness of the trend line represents the strength of the trend.
A shallow line indicates a possible sideways movement. Stay out of swing trade in such market conditions.
The Ultra steep trend line shows a possible unsustainable trend. Look for trend reversal under such market conditions.
The trend lines act as a dynamic support/resistance zone for trading setup. It provides a practical way to look for a retracement zone.
The break of the trend line theoretically represents a possible reversal in trend. But in a trending market, most of the time trend line breaks are false ones.
#You also Learn: Intraday Trading Strategies That Work (2021)
Multiple time frame use of Trend Line for Swing Trading:
1. Selection Of Stock (Daily Time Frame):
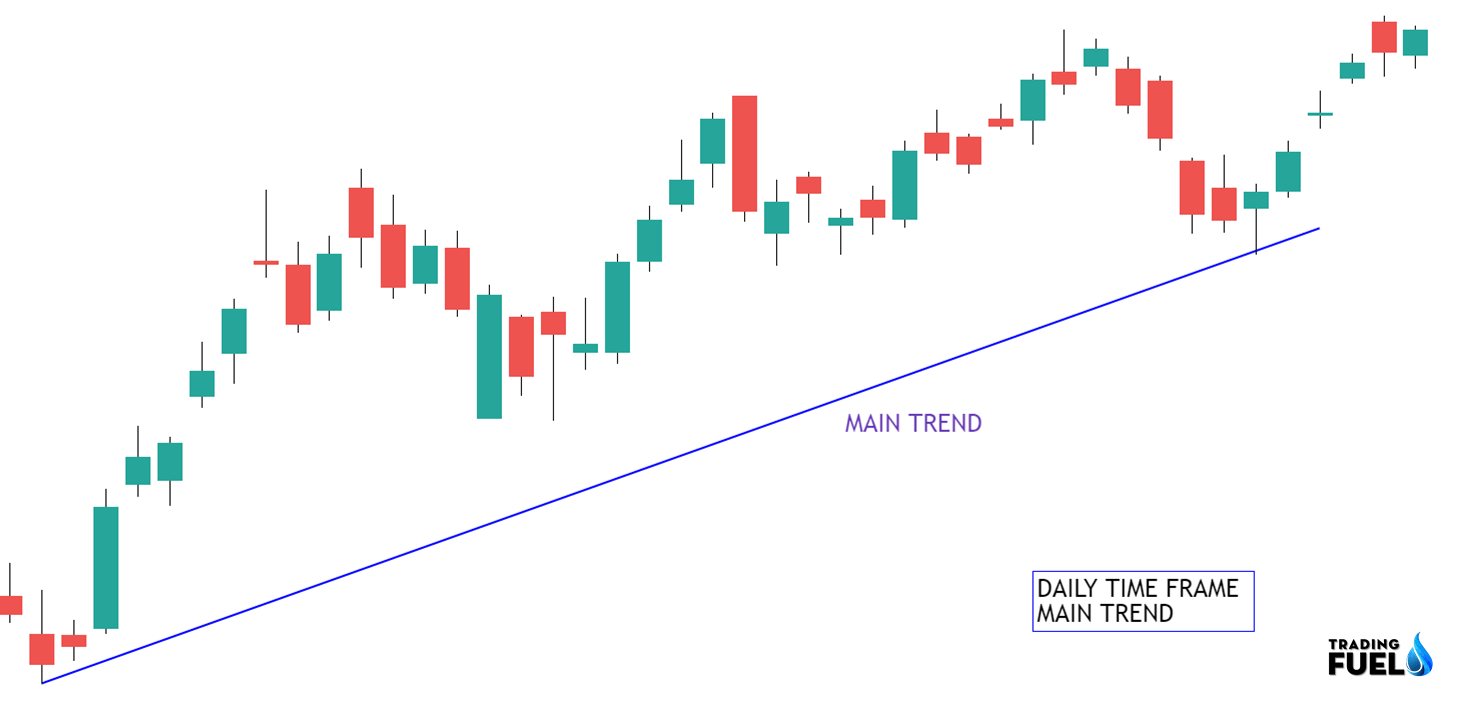
- Here the main aim is to identify the trend of the stock, which can be an uptrend, downtrend, and sideways trend.
- Here we like to filter out the sideways market and avoid trading in them.
- Share having a genuine uptrend, whose angle is neither steep nor shallow are more preferable.
- As in the example above the trend line is indicated by a blue line having a good inclined angle.
2. Selecting hot stock (one hour):

- After identifying a short term uptrend in the daily time frame. We will look for a retracement of the price.
- As shown in the image above the price bounce from 21000 levels forming a trend line in the higher time frame (daily).
- In the hourly time frame, our main aim is to find a counter-trend (pink line), Here which is opposite to the main trend (blue line).
- Here the pink line is the counter-trendline in a lower time frame (1 hour).
- We will look for the break out of the lower time frame (1 hour) trend line to trade in the direction of the higher time frame trend line.
3. Entry (30 min):

- Here in 30 Minute time frames, we will look for the breakout of the candle.
- The breakout candle must be a bullish candle for longs and a bearish candle for shorts.
- The break out candle must break the trend line with heavy volume.
- We aim to identify the breakout which is in the direction of the main trend line (daily time frame).
- For a short trade, the daily trend line must have a downward slope.
- In the above example after a green bullish candle breaks the hourly trend line and closes above it, after which we can initiate our long trade.
Bullish Trend Line:
- Fine two support points.
- The second point must be at a higher price forming higher lows.
- Connect these two points to make sure the line does not cut another candle.
- Project the resulting line to the right.
- Now you have a trend line, representing the direction of the trend.
Example of a bullish Trend Line:

For buying in an uptrend:
- Draw an uptrend trend line consist of a minimum of 2 higher lows.
- Wait for the price to retrace back to the trend line.
- Look for rejection/bullish candle formation near the trend line.
- Place a buy order above the high of the candlestick that touches the trend line.
- Place your stop-loss order below the low of that candlestick.
- Place your profit target level near the previous high.
Bearish Trend Line:
- Fine two resistance points.
- The second point must be at a lower price forming lower highs.
- Connect these two points to make sure the line does not cut another candle.
- Project the resulting line to the right.
- Now you have a trend line, representing the direction of the trend.
Example of a Bearish Trend Line:

For shorting in a downtrend:
- Draw a downtrend trend line consist of a minimum of 2 lower highs.
- Wait for the price to retrace back to the trend line.
- Look for rejection/bearish candle formation near the trend line.
- Place a sell order below the low of the candlestick that touches the trend line.
- Place your stop-loss order above the high of that candlestick.
- Place your profit target level near the previous low.
Some Trend Line Drawing Tips:
- More time the price touch a trend line higher it’s significant.
- It takes two points to draw a trend line, but it takes three touches to confirm the trend line.
- Stepper the trend line less would be it’s significant.
- The price breaking trend line is not a reliable confirmation of trend reversal.
Conclusion:
In this blog we have described the trend line form its basic construction and its theory, how can we use it for swing trading. The trend line is easy to learn and understand because of their easy construction and layout, they provide vital information line, trend direction, the strength of the trend, movement, etc. by simply constructing a line between two points. But one must backtest the working of the trend line because there are lots of market conditions under which the trend line gives a false signal.
For Free Online Chart: Investing.com
Contain & Image ©️ Copyright By, Trading Fuel Research Lab