The volatility contraction pattern (VCP) became popular by Mark Minervini in his books Think and Trade like a Champion and Trade like a Stock Market Wizard. This pattern is widely used for swing trading, but in this blog, we will discover how to use it for day trading.
History of the Volatility Contraction Pattern
Most successful traders refer to the pattern as simply a “high tight flag.” However, that pattern works with certain criteria that may not fit the VCP.
The VCP pattern is based on Richard D. Wyckoff’s “wave pattern,” which provides a high rate of success when executed correctly and mostly It looks like a bull flag.
Regardless, the setup has been inspired by the teachings of Bill O’Neil and his famous book “How to Make Money in Stocks”.
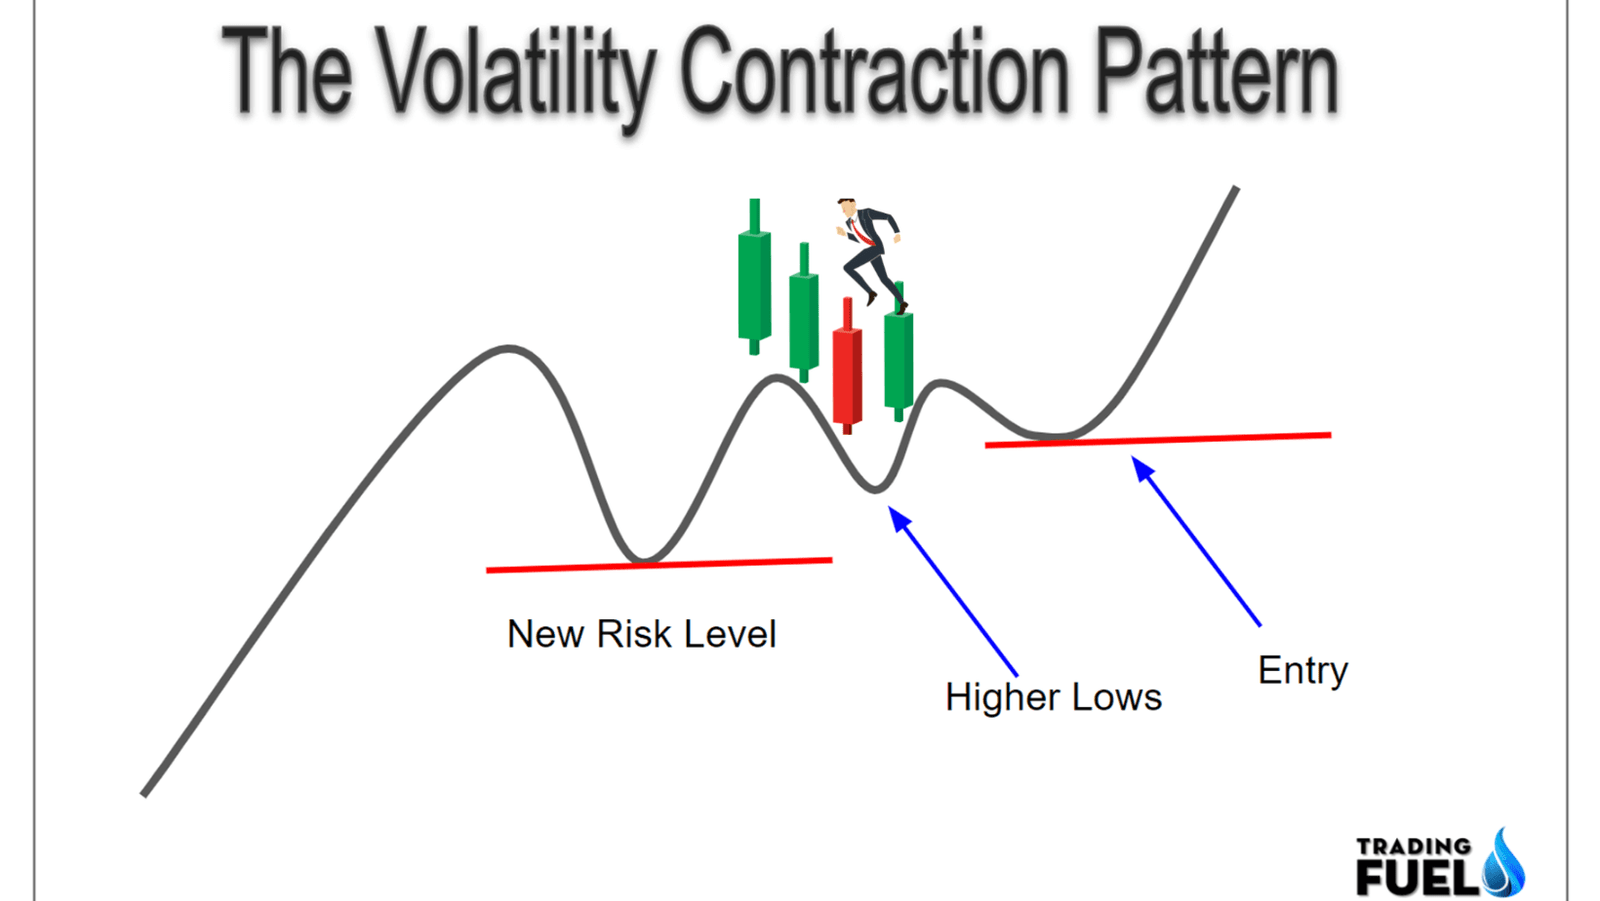
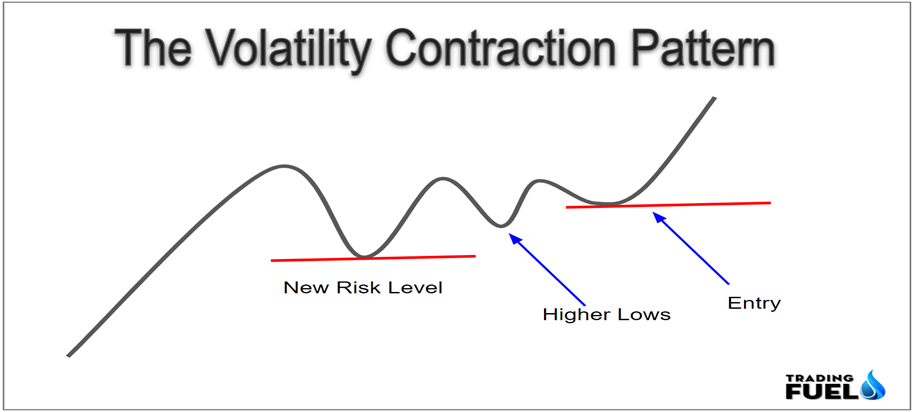
Minervini discovered that some of the market’s successful traders used their technique to pause during new uptrends. This technique created a coiling action after the initial upward force. It also gives a low-risk opportunity to start fresh for the next uptrend.
Don’t Miss: How to Select Stocks for Intraday Trading?
Why the Volatility Contraction Pattern?
When you analyze and use different setups or patterns for trading, it is also important to manage risk. It is equally imperative to have an edge.
Successful traders know very well, that the market is a game of probabilities. If you are trading losses will be there in your p & L. But the system or setup that provides a higher reward/risk ratio can provide overall profits.
This is where the VCP is useful. It helps traders to take a position in a stock with growing momentum with minimum risk.
What is the Volatility Contraction Pattern?
1. Strong Underlying Demand
For the volatility contraction pattern, the stock must be in demand. This means buyers should be active in the particular stock.
To identify that demand, finding a strong uptrend is an easier way. You may find it opposite to human nature, but the best VCP patterns occur from big strong moves.
VCP patterns give a buy signal at a point where many investors or traders think that a stock is overbought. However, Experienced momentum traders Identify the demand and take advantage of it. This is the best example of buying high and selling higher.
When you are looking for an intraday VCP pattern, you need to consider the following criteria.
1. A premarket gap open or big move off the open
2. Increasing Volume compared to the previous day’s average
3. The possibility for a breakout on higher time frames
4. Price taking the support (like a daily pivot or moving average)
5. Incompetence to breakdown
Also Read: What is Volatility in The Stock Market?
Volatility Contraction Pattern Example
Considering these 5 points, let’s look at an example of VCP for intraday trading in the Glenmark stock.
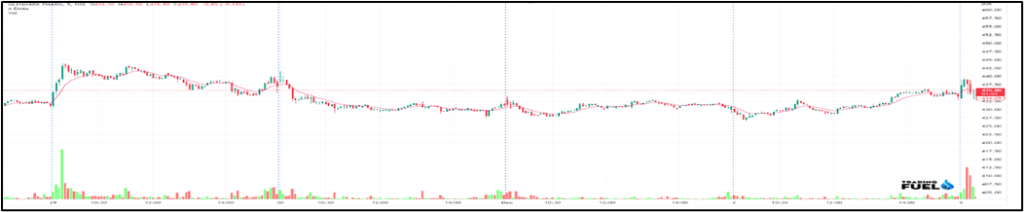
Starting with the daily time frame, check the daily pivot and moving average for support markers. In the image below, we can see that there was an extremely bullish day a few days prior.
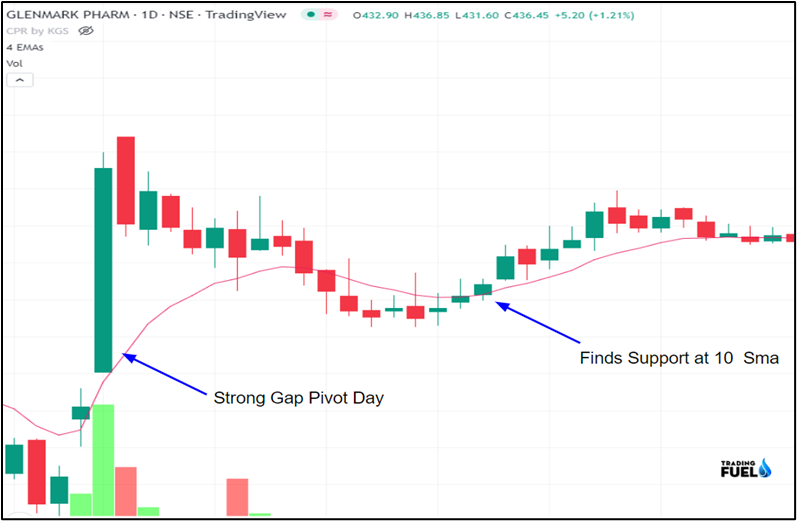
We can also see that the price is now surfing at the 10-day simple moving average. Each time the price retreats to those levels and volume decreases. This indicates that supply is diminishing on the daily time frame.
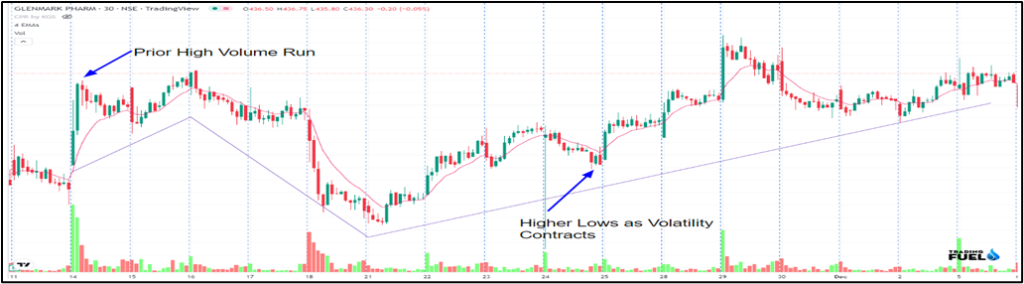
From this daily time frame, let’s switch to the 30-minute time frame.
On the 30-minute chart, we can see that the price is making higher lows. The volatility starts to contract into the current day, which suggests that the chances of the price breaking down are low.
Now that we have analyzed the higher time frame, switch to the smaller time frame for intraday.
Pre-market Gap
The chart below shows the previous day’s high, close, after-hours, and pre-market action from the current day’s morning.
The current day’s volume is higher than the previous day’s average volume. Just before the opening at 9:15 am, the price is already testing its prior day’s high in the pre-open market. You can check pre-open market data on the NSE India website.
Considering these points, you can keep such types of stocks on your watchlist for high-probability trades.
Also, Read: How to Trade Intraday in Indian Stock Market?
2. Recent Overbought/Supply Pressure
In the pre-market session, the stock price was open above the 6% gap, and it is retesting the previous day’s highs, so there would be some amount of profit-taking or selling pressure off at the opening time of the market. This is a common level to book profits in scenarios where the breakout fails.
This situation creates an underlying compression of bears and it looks like buyers and sellers are trying to overcome each other.
As a trader, you need to identify who has a strong position in the battle. The Volatility Contraction Pattern helps to identify it.
To see how to trade with it, let’s have a look at XYZ stock just after the opening.

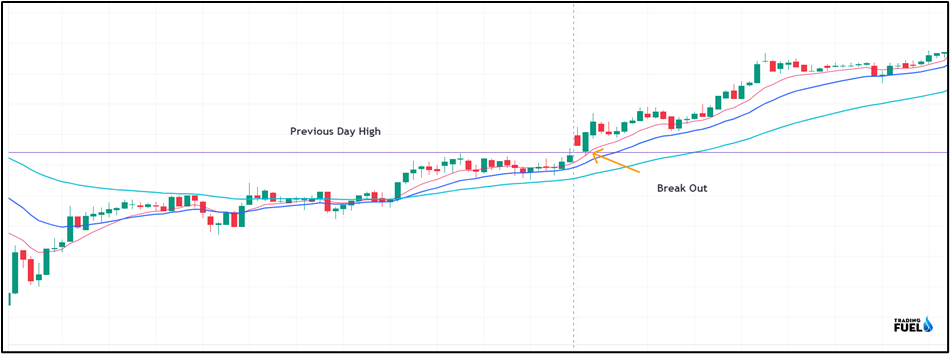
We draw a line at the previous day’s high to understand the importance of this level. We observed from the premarket chart that resistance was showing up at the pivot as shown in the image. So, we need to mark these key levels.
In the morning session, the price was bullish, it became clear that the price of the stock is not breaking down.
3. Diminishing Supply / Decreasing Volatility
After you check the “overbought” correction, you need to identify how the stock price reacts. Is it taking support again? If yes so, where, and how?
You need to check all the points with volume and price action.
When the price goes up with a high-higher-low pattern, at every pull back volume is less. This pull-back area is called volume dry-up.
Volume Dry Up (VDU), is useful for finding a lack of supply in a consolidated market. Now, at this point in the consolidation, you need to see the stock price holding a support level like VWAP or a mostly used moving average like the 10, 20, or 50ma.
4. The Breakout
As the increase in demand begins to overpower the bears, there are high chances that bulls are going to win. And as we stated above, it depends on the pressure being applied by the bears.
The first signal is that the high-volume bullish candle immediately follows the Volume Dry Up candle. After finding support along with 20 ema and the pivots having higher volume.
You can see the increase in the volume as the price starts moving upward. Here, breakout traders grab the opportunity. At the same time, bears have to make a decision. Either get out before the loss gets worse or average up and hope that it might be a failed breakout.
As the breakout continues and the price goes higher, bears are now in trouble, especially if they were averaged in from the previous day’s high. They have only one option, which is to exit the trade.
As the short covering starts, it provides volume to the bullish character of the stock, so as a result, the stock moves up more than 13% in less than 2 hours.
Must Know: Candlestick Patterns
How to Practice the VCP?
Once you know the VCP completely, it is important to practice the pattern in a simulator before putting real money into the trade. With this practice, You need to identify if the pattern works or if it might give false signals.
When you analyze each trade, keep the points below in your mind.
- Is the price holding moving averages and VWAP?
- Are bulls more powerful compared to bears?
- Is volume higher than usual?
- Could bears become trapped?
- Is the stock price closer to support and resistance? If yes then how much?
- Does supply move back on pullbacks?
- Do you confirm the volume at the time of break out for the right break out?
- Does the breakout continue or fail?
These points are helpful for you when you check the setups and trade them.
Contain & Image ©️ Copyright By, Trading Fuel Research Lab