
The descending triangle pattern is one type of chart pattern used by traders for price action trading. The Pattern usually appears at the end of a downtrend or after a correction to the downtrend or as a consolidation in an uptrend.
Traders can use of descending triangle pattern in order to trade the breakout.
Is descending triangle pattern bullish or bearish?
A descending triangle pattern can be bullish or bearish also. Most traders consider this pattern as a bearish pattern. But as mentioned sometimes it can also turn out to be bullish we can say that it is a reversal pattern.
So the descending triangle pattern can be considered either a continuation or a reversal pattern. When there is an established downtrend this pattern appears.
If the descending triangle breaks out upper direction, then it becomes a reversal pattern.
Must Read: Continuation Chart Pattern: Part-4
What is descending triangle pattern?
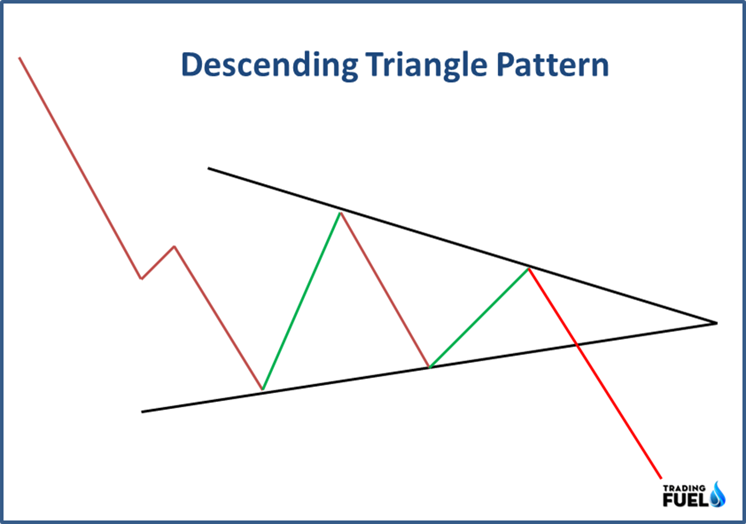
As shown in the picture, the pattern forms with a trend line sloping downwards and another line which is called a support line usually flat or horizontal.
In this pattern, you can see that the price bounces off the support level minimum of two times, and this pattern you can find generally at the end of a pullback in a downtrend.
When the price breaks the support level, there is a signal of continuation of the downtrend.
How to trade a descending triangle pattern?
Mostly, the breakout of the supporting line of the pattern gives a sell signal. The distance between supports to the first high of the triangle is projected to be a downside for the target.
As mentioned earlier, not all the time price gives a breakout toward the downside of the descending triangle.
Sometimes it can break out in the upward direction of the pattern and you can take a buy call as it became a reversal pattern. And you can put a target which is the distance between supports to a high of the triangle
What does the descending triangle pattern indicate?
Usually, this pattern is a consolidation which indicates price stops moving in its current trend. It can either continue moving with the previous trend or may start a new trend (reversal).
In this blog, we are going to discuss different methods to use and trade the descending triangle pattern.
Before we jump to different strategies, the target for all strategies will be the same so first, let’s see how to get the targets.
Price Target Projection
To get the target, first, measure the distance from the first high to the first low of pattern a and project the same after you find the breakout.
Most charting platforms provide measuring tools so that you can easily measure and project them for targets.
#1. The Descending Triangle Breakout strategy
This strategy is very simple and easy to use. When you find a breakout of the triangle you can go for the trade. And the volume confirms the breakout.
Points to be considered for this strategy are:
• The stock must be in a downtrend or in a consolidation phase. You can select a time frame as per your comfort level.
• Now, if you find price making triangle, look at lower lows and lower highs and draw the descending triangle pattern as you can see below example.
• If you find the descending triangle pattern. You will find that volume is also very low at the end of the descending triangle.
• The chart below shows a descending triangle pattern formed after a downtrend and at the end, the price gives a breakout for the buy side.
• Now after the breakout, you can check the volume for double confirmation.
• For the target, measure the distance from the first high and low and project it from the entry level.
• So here you can see that the target is achieved.

You can use this pattern once you are done practicing this pattern and if you find it suitable to your trading style.
Also Read: Price Action Trading ( A to Z Info )
#2. The Descending Triangle Pattern with moving average.
You can combine candlestick charting patterns and price action techniques with technical indicators for double confirmation. Not all indicators give a good result, but indicator like moving average is one of the simplest and most popular indicators to use with.
For this strategy, you need to first look for the descending triangle pattern and its breakout.
Here, the moving average indicator gives the signal to enter into trade. In the example below, we use a 1-hour time frame and 10 and 20 exponential moving averages. You can also select 20 and 50-period EMA.
Now you can see this image that along with breaking out the crossover of 10 and 20 EMA also confirms the buy signal.
You can consider increasing volume while price gives a breakout of the descending triangle.
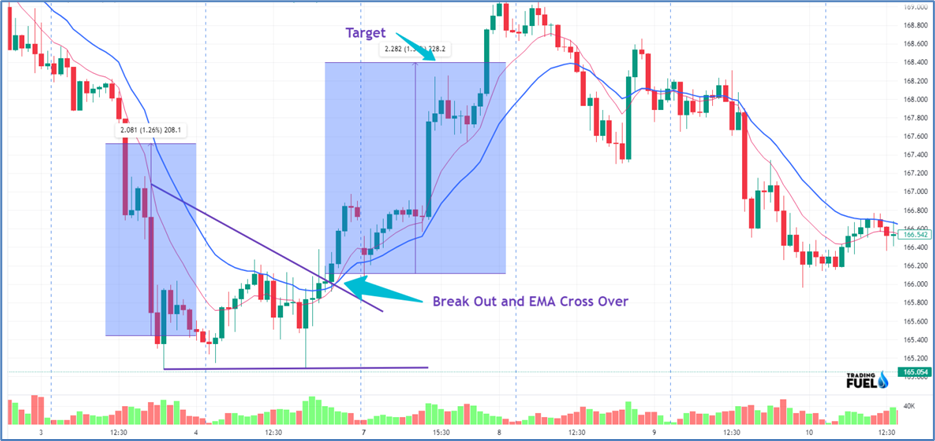
In this strategy, you will get double confirmation using EMA. The target price is the same as explained in example no: 1.
#3. Reversal Breakout of Descending Triangle Pattern at Bottom
The reversal of the descending triangle pattern at the bottom end of a downtrend is the direct opposite of a distribution event. In this example, you will find that there is a horizontal support level and at the bottom, the price is taking support and bouncing back more than 2 times.
The price is taking major support here and trying to move upward; the price breaks the resistance level and went up.
When you find this kind of descending triangle pattern, wait for an upside breakout and then you can go for a long. The target will be the same as shown in the above examples.

In the above chart, you can see how the price falls and then takes support at the bottom for a long time. The price breaks a sloping line which acts as a resistance. And achieved the target.
# 4. Descending Triangle pattern reversal at the top:
You can find the descending triangle pattern at the top after the end of a strong up trend. This pattern forms at the end of the uptrend when volume declines and stock price fails to make new highs.
The formation of the pattern at the top indicates that the uptrend is exhausting and the price takes a horizontal support level.
After the price gets rejected from the resistance level, the chances of the price going downside will be high.
The target price for the sell trade will be the same as we discussed and also explained below example.
This pattern can be very useful and easy to trade when you find it and get the right entry after the breakout.
The example below, shows there was a strong bullish momentum and at the top price starts to consolidate and after that, it breaks down.

The price gives a sell breakout and after that, a strong downtrend was established. The target level is equal to the distance between the high and support levels as shown above.
Also Read: Top 10 Best Technical Indicators
#5. Descending Triangle using Heikin Ashi Charts
Usually, we look at the candlestick charts for different charting patterns, but it also works great with Heikin Ashi charts you can also find descending triangle patterns to make a simple but powerful trading strategy.
Heikin Ashi visually stands out as compared to other chart types. One of the unique characteristics of this chart is you can clearly see the trend. If you are a beginner and it is difficult for you to find the trend then simply switch to Heikin Ashi charts it will be easier.
To use this strategy, first, wait for descending triangle pattern to be formed.
Once you find the pattern, wait for a bullish breakout at that time the bullish Heikin Ashi candle forms.
Now after getting a break out you can go for a long and the target will be the same as the above strategies.

The example shows the Heikin Ashi chart for 1 hr time frame and you can notice that at the time of breakout Heikin Ashi candle turns into green.
Read More: Heikin Ashi Trading Strategy
Trading tips for the Descending Triangle Pattern
- You will find the descending triangle pattern when the market is sideways.
- You need to practice the pattern then you can use this strategy for trading.
- This pattern is also known as a measured move chart pattern, so for the target, you measure the distance and project after the breakout for targets.
- The descending triangle pattern works better with technical indicators as we explained in the example.
- When you find the breakout, the volume should be rising from the entry point.
Conclusion:
The descending triangle pattern is a classic chart pattern that shows the consolidation phase in a stock. Breakout of the patterns gives strong momentum. Once you master the pattern you will get good results.
Contain & Image ©️ Copyright By, Trading Fuel Research Lab