- There are several bar setups that we need to check before entering into any trade.
- One such setup is the inside bar candle setup.
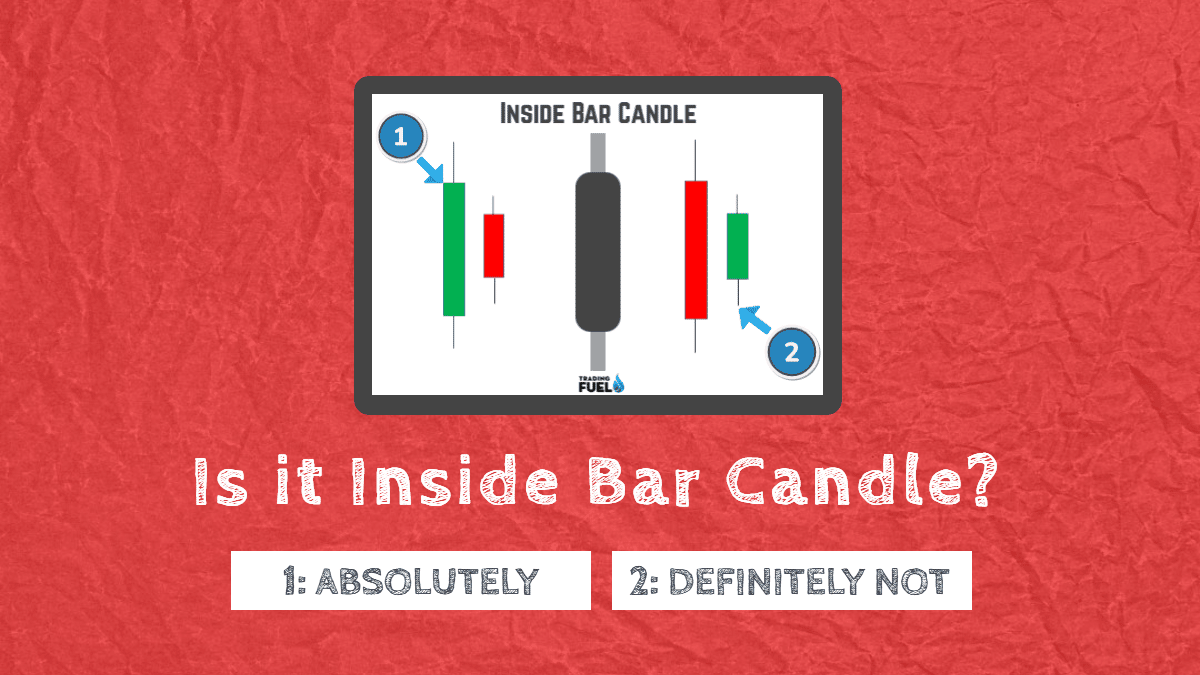
What is an inside bar candle pattern?
- An inside bar candle is nothing but the inside of a large candle. Some call the large candle the mother candle.
- An inside bar candle pattern is formed after the market shows a long move and also represents a period of consolidation.
- Many experts consider the inside bar candle pattern to be a very powerful price pattern if you try to understand how to trade with it properly.
- The range of the inside bar candle cannot be outside the mother candle by even 1 point.
- The insider bar candle setup can also be known as the breakout or the reversal pattern.
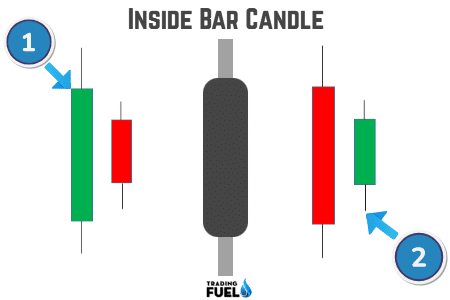
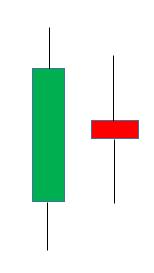
The very basic inside bar candle setup looks like this:
Few facts about the Inside Bar Candle Pattern:
- The inside bar candle pattern is within the trading range or generally the shadow of the preceding bar.
- The mother candlestick can be either bullish, i.e. green, or bearish, i.e. red.
- It is at least a two-candlestick formation chart.
- The inside bar candle pattern can be either bullish or bearish.
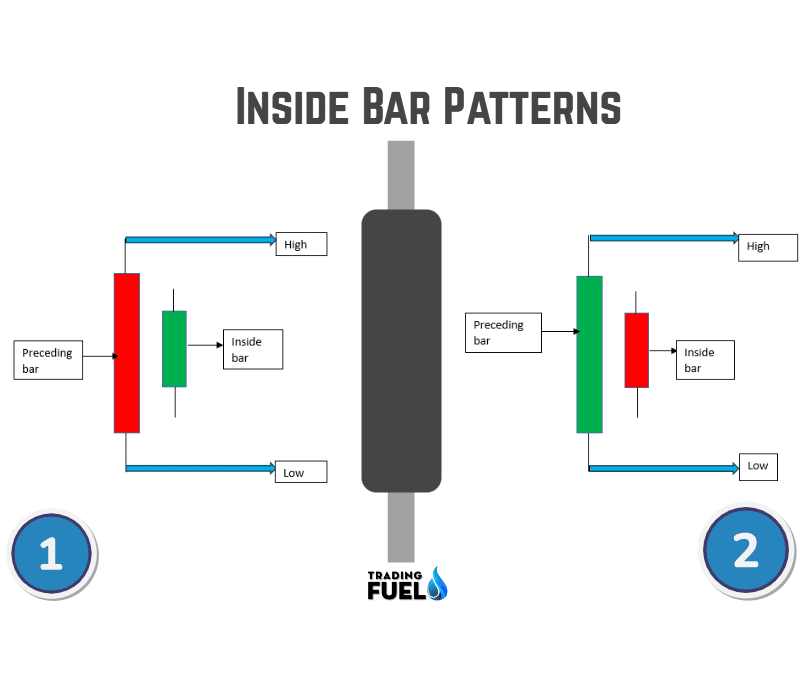
The following candle patterns will give you a brief idea of the same:
Characteristics of knowing the inside bar candle setup:
There are a total of six important characteristics for knowing the inside bar candle setup.
The following are the 6 main characteristics for the same:

Works extremely well in the trending market:
- If you plan to trade using an inside bar candle setup, then you should firstly understand the market trend.
- This strategy will not be helpful in the sideways market as there are very small chances to find such a candle setup.
- In fact, it is very important to trade with the trend to understand the inside bar candle setup.
Choosing the correct time frame:
- The next important characteristic is the time frame for setting up the inside bar.
- In general, any time frame shorter than the daily chart should be avoided with this strategy.
- The reason behind this is that the lower time frames are generally influenced by noise, and therefore they might end up producing false signals.
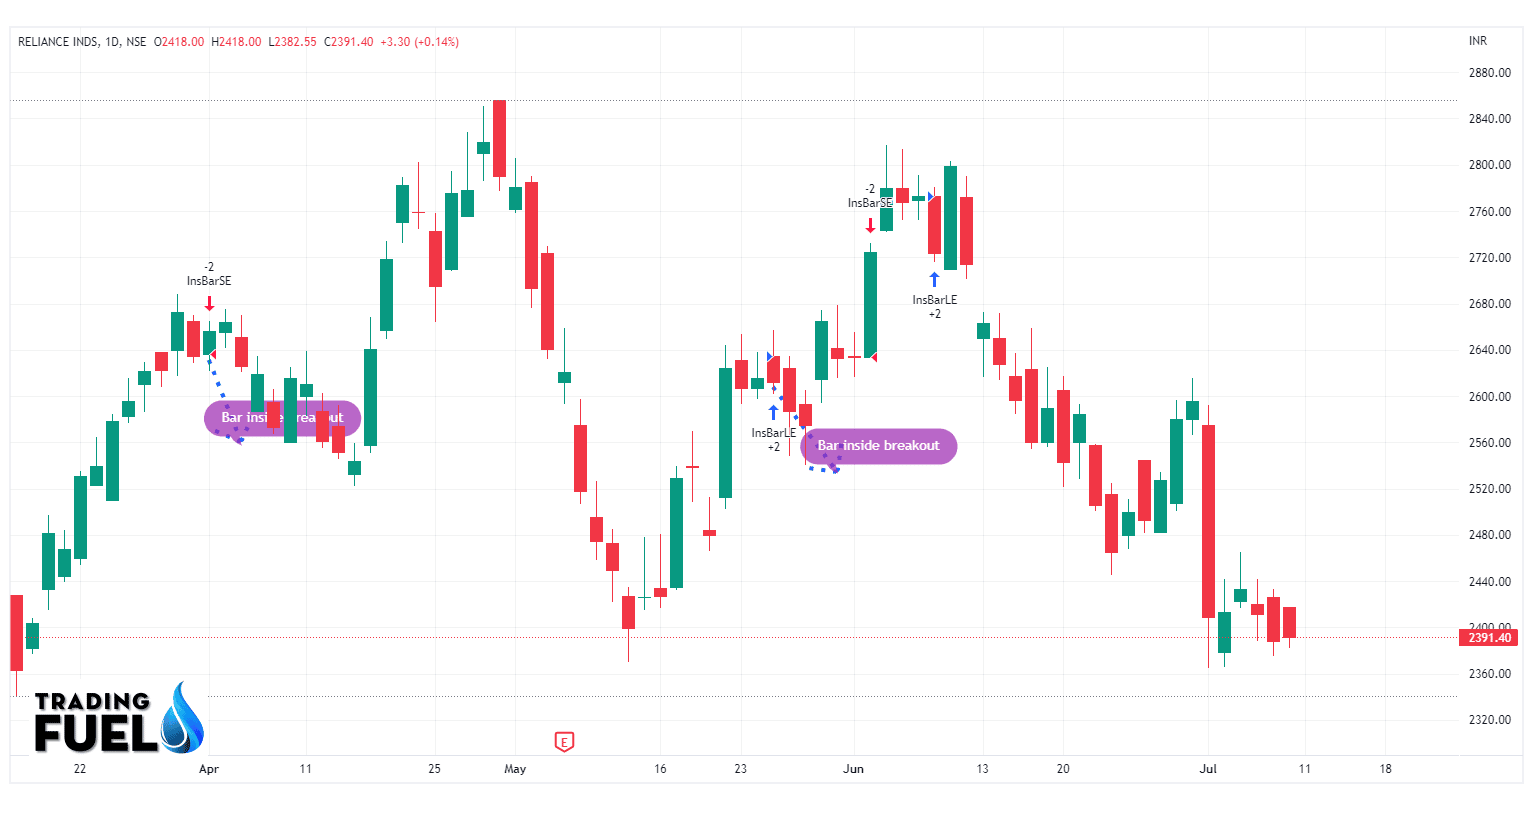
- The inside bar candle patterns are shown below in the chart as: Ins Br

Inside bar setup on a Pattern breakout:
- The best inside bar pattern is formed just after the breakout from the preceding pattern.
- The reason here is very simple. In the entire trend, the consolidation is triggered when longs decide to begin taking profits, in other words, sell.
- This will cause the market to pull back where new buyers will take the charge to buy, which in turn will keep the price elevated.
- This inside bar pattern will continue for days, months, or even weeks till new buyers once again outweigh the sellers and drive the market in an upward trend.
- The best bar inside the breakout for Reliance is as shown below:
Size of the mother candle and the inside bar candle:
- The size of the inside bar candle compared to the mother candle is very important to note.
- In my experience, the smaller the inside bar as compared to the mother candle, the greater our chances of experiencing a profitable trade setup.
- We have to compare the inside bar form with the upper or lower half of the mother bar.
- We have to note that if the mother candle has a weak body, then you need to think twice before trading.
- The body and the size of the mother candle are very important and then look at the size of the inside bar candle.
- If the inside bar is smaller than the mother candle, then this setup will help you to generate much better results.
Entering, Exiting, and Stop Loss in the Inside Bar Trade:
- Entering: When the price hits an inside bar candle, you should mark the high and low of the consolidation range.
- These two levels will be used as the triggers for any potential trade.
- The inside candle will give a clue, but it will not provide information about the direction of the breakout range.
- Here, if you see the range going upwards, then you can go long; but if you sense the range going downwards, then you should short-sell.
- Exiting: It is very difficult to project the exact movement of the inside bar breakout.
- There are often chances of prolonged moves after the breakout, so it is also very important to inculcate the habit of adding a stop loss to your trade after the price is moving as per your expectations and you have achieved your desired profit. This strategy is known as the “smart trade management strategy.”
- Stop-Loss: The buffer of 1% above or below has to be your stop loss.
- The below chart will help you understand it better:

Inside bar pattern will help in identifying changes in the trend:
- The inside bar candle pattern is considered a very valuable tool because it will help us identify that the market is not as bearish or bullish as it was in the preceding periods.
- Being able to identify the periods of market expansion and contraction will help any trader improve their odds of finding a winning trade because we know from history that the expansion and contraction can last a long time.
- When any of the market phases end, the resulting move will be totally explosive.
How does the Inside bar work?
Not all the inside bars are equal.
There are the following different types on the inside bar:

Inside bar with small range:
- This bar is the standard inside bar where the range of the candle is small and is covered by the previous candle.
- This will indicate indecisiveness and low volatility in the market.
- This is how it looks:
Inside bar with large range:
- There are also candles with an inside bar with a large range.
- Here, you will notice that the inside bar is too large.
- This will indicate indecision or a reversal in the market.
- The large inside bar with the bullish close shows the signs of strength as follows:

The large inside bar with the small body and showing the signs of indecision is as follows:

Multiple Inside bars:
- This is considered the most powerful pattern because it will show low volatility in the market.
- Volatility in the market moves from low to high.
- So when there are multiple inside bars, we have to be ready for a big move in the market.
- The multiple inside bars look very much like this:

The Hikkake Pattern: a type of variation of the inside bar:
- Let us imagine that you have identified an inside bar and are feeling bullish.
- So here, you tend to go long when the price breaks above the high of the inside bar.
- But then you realize that the market will soon call for a reversal and collapse lower, and you end up in the red.
- This is known as the Hikkake pattern, or particularly a false breakout pattern.
The bearish Hikkake pattern looks like this:

The bullish Hikkake pattern looks like this:

The Hikkake pattern can be traded in the same way we trade using an Inside bar.
Tips for trading using this setup:
- As a beginning trader, it is easy to learn how to trade with the inside bars that are in line with the dominant daily chart trend or are in line with the trend. Inside bars at the reversal are a bit trickier and will take more time and experience to become professional at.
- Inside bar, candles work best on the daily chart time frame because in the lower time frames there are too many inside bars and many of them are meaningless and will lead to false breakouts.
- An inside bar can have multiple inside bars within the mother candle. Sometimes, you can find 2, 3, or even 4 inside bars within the same mother candle. This will simply show a longer period of consolidation, which often leads to a very strong breakout.
- You need to practice identifying the inside bars on the charts before you try to trade them live. Your very first inside bar should be on the daily chart and should be in the daily trend.
- Inside bar candles can form pin bar patterns and are part of the fakey pattern, making them an important price action to understand.
- Inside bars will typically offer good risk-reward ratios because they often provide us with a tight stop loss placement and will lead to a strong breakout as the price breaks up or down from the pattern.
Advantages & Disadvantages:
The inside bar candle depicts the continuation or the reversal, which will help us in the trades.
The main advantages and disadvantages of this are as follows:
Advantages:

Disadvantages:
It can signify reversal or continuation patterns.
Conclusion:
I hope the above blog about the inside bar has helped you gain an understanding of the inside bar candle setup.
Frequently Asked Questions (FAQs)
About Us:
Trading Fuel is our blogging website where we provide you with blogs related to technical analysis, share market, finance, and economics. Stay tuned with us for more such technical blogs.
Contain & Image ©️ Copyright By, Trading Fuel Research Lab