
1. Double Top and Double Bottom Pattern
A. Double Top Pattern:
i. What does a double top look like?
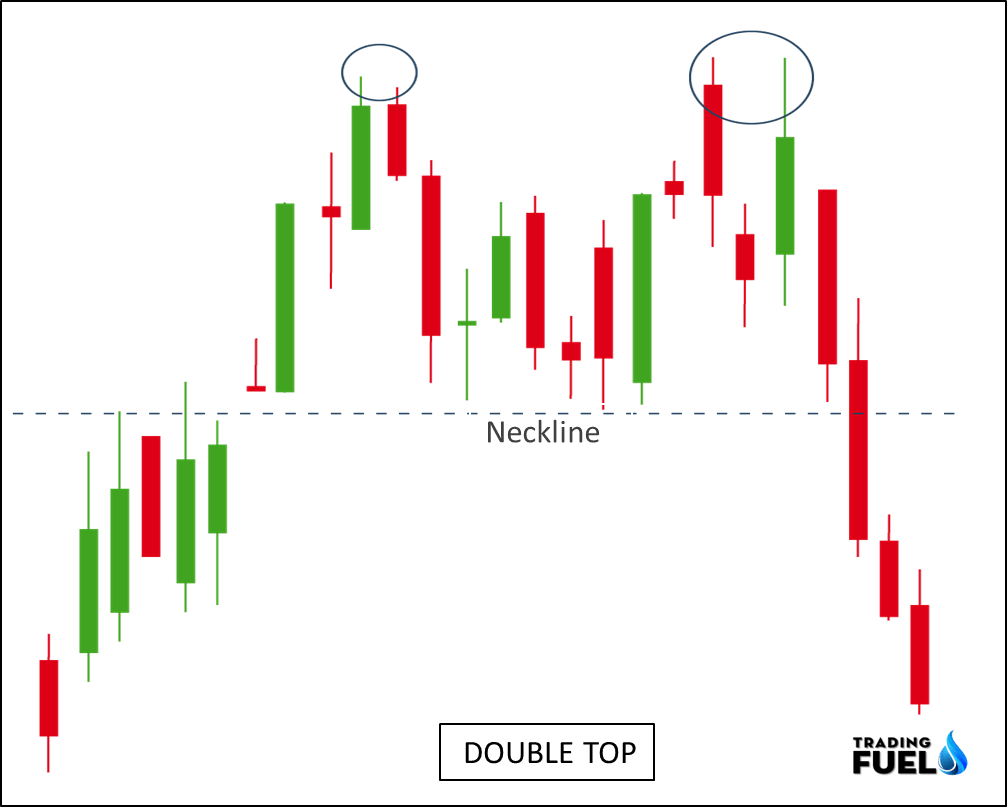
A double top pattern occurs when the price fails to make a new high.
Double top patterns are relatively reliable and easy to trade. Also, these patterns fail as they may potentially form triple or multi top formation.
The double top usually signals the end of the Bull Run depending on the width of the top formation.
The volume in the first swing should be heavier than the second swing. In addition to that volume must be heavier on the breakdown bars.
If the breakdown volume is weaker it may be signaling a triple top formation.
A double top is an important pattern that trader use to spot key reversal point in a trend.
ii. How to trade Double Top Pattern?
Trade: A double top pattern confirmation occurs at the breakdown level of swing lows at the neckline.
Enter: After a candle breaks the neckline with heavy volume, a short trade can be entered below the breakout candle low.
Target: Double top patterns do offer a good risk and reward ratio. Measure the distance between the top of the pattern to the neckline for a potential target range from the entry-level.
Stop loss: Double top also fails and forms the triple top or multi top patterns. Usually, the double top pattern failure occurs when price reversal and trade in the middle of the double top pattern. Enter stop order in the middle of the pattern range to protect the trade.
iii. Volume confirmation in the Double Top:
A trader should pay close attention to volume when analyzing a double top.
Generally, Volume in a double top is higher on the left top than the right.
Volume tends to be downward as the patterns form.
Volume increase again when the pattern completes, breaking through the confirmation points.
iv. Rules for the Double Top:
If the second peak is higher more than 3% of the first, the pattern may not be a double top.
If the second peak stays higher than the first peak by more than a couple of days then the pattern may not be a true double top.
Two peaks don’t need to have the same price level and it does not mean an invalid pattern.
Example for the double top:

Entry: After the price breaks the neckline, we can place our short position or we can enter at a retest of the neckline if retest occurs.
Exit: For this setup, our minimum target will be equal to the distance of peak form neckline (H).
Stop loss: To protect our capital from a failure setup it is necessary to place a stop order above the peak of the pattern.
B. Double Bottom Pattern:

A double bottom is a bullish reversal pattern.
The double bottom pattern indicates the dominance of the buyer in the market.
Inside a double bottom, price drop to a support level then rise to a resistance level and gain drop to form the second leg of the double bottom.
After the formation of the second leg of the double bottom, the price will rise and break the resistance level.
Finally, the trend will reverse and the price will go up as the trend became bullish.
Note: The trading rule for the double bottom pattern is similar to the double top pattern, the only difference is that we were taking a short position is double top, whereas we are looking for a long trade setup in the double bottom pattern. Double top and double bottom are opposite to each other in terms of their characteristic.
(Bonus) Triple Top and Triple Bottom
A. Triple Top Pattern:
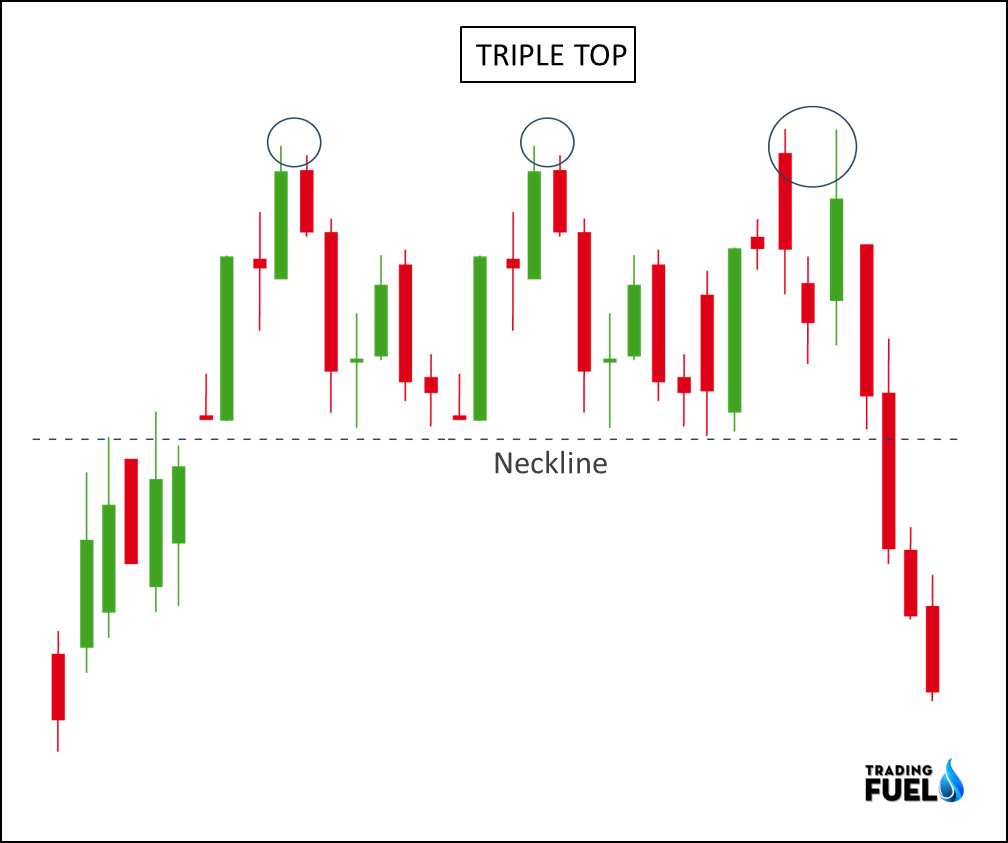
i. What does a Triple Top look like?
Triple top patterns are multiple top patterns indicating exhaustion of the buyer in the market as price tries to make new high and fail.
The triple top pattern looks like a head and shoulder pattern, and it is a reliable pattern to trade.
The triple top pattern does tend to fail, so you must always follow proper risk management.
Triple top pattern lows must be within the range of 2% to 5% of the price.
The triple top is relatively easy to detect and offer a good risk to reward ratio.
A confirmation is needed before entering to trade, heavy volume during the breakout of the neckline.
ii. How to Trade Triple Top?
Trade:
Two types of trade setup are possible in the triple top pattern.
An aggressive trade is placed near the last attempt at the lower high of the previous two swings high.
The second trade is possible when price closes below the lower low of the two previous swings with heavy volume at the breakdown.
Target:
Both entry targets can be set at a distance equal to the depth of the triple top, which is the distance between the swing high and the break down level.
Stop:
Triple top pattern fails when price closed above the highest swing high of the pattern. So Place a stop loss above the swing high of the triple top pattern.
iii. Volume confirmation in the triple top:
A trader should pay close attention to volume when analyzing a triple top.
Generally, Volume in a triple top is higher in the 1st top than the other.
Volume tends to be decline as the patterns form
The third top must-have the lowest volume, indicating the exhaustion of buyers.
Volume increase again when the pattern completes, breaking through the confirmation points.
B. Triple Bottom Pattern:

The triple bottom patterns are a reversal pattern that occurs at a major market bottom.
Triple bottom patterns formed when price failed to make new lows on three different levels.
Most triple bottom patterns lows occur within 2% to 5% of the price range.
The triple bottom is relatively easy to detect and offer a good risk to reward ration.
Trade can only be indicated after a confirmation.
For confirmation, we will look for heavy volume in the first swing down but the rest of the swing will have decreasing volume.
During the breakout of the neckline, there must be a sharp increase in volume.
Note: Trading rule for the triple bottom pattern is similar to the triple top pattern, the only difference is that we were taking a short position is triple top, whereas we are looking for long trade setup in triple bottom pattern .triple top and triple bottom are opposite to each other in term of theirs characteristic.
Example of the triple bottom:

Entry: After the price breaks the neckline with heavy buying volume, we can place our long position. or we can enter at a retest of the neckline if retest occurs.
Exit: For this setup, our minimum target will be equal to the distance of the bottom price to the neckline.
Stop loss: To protect our capital form a failure setup it is necessary to place a stop order so for this setup we will place our stop loss below the bottom of the pattern.
Learn More About: How To Read Stock Chart?
Conclusion:
In this article, we have discussed reversal patterns that are used by the majority of trader, double top, and triple top are bearish reversal patterns in which the double bottom and triple bottom are bullish reversal patterns. These are high probable setup which provides good risk and reward ratio. As these patterns are easy to identify in a trending market novice traders can easily spot them and following above mention rules will surely help them to trade in a disciplined manner.
Contain & Image ©️ Copyright By, Trading Fuel Research Lab