10 Price Action Candlestick Patterns | Trading Fuel Research Team:
Candlesticks are a graphical representation of the market sentiment which could be bullish, bearish, or indecisive movement.
Candlestick Patterns can have one candle, two candles, or a combination of three candles.
The candlestick is used for defining entry and stop-loss, depending upon the pattern formation.
In this blog, we are going to see how we can use several candlestick patterns to spot key reversal zone in the chart.
1. Reversal Candlestick Patterns:
- What does it look like?
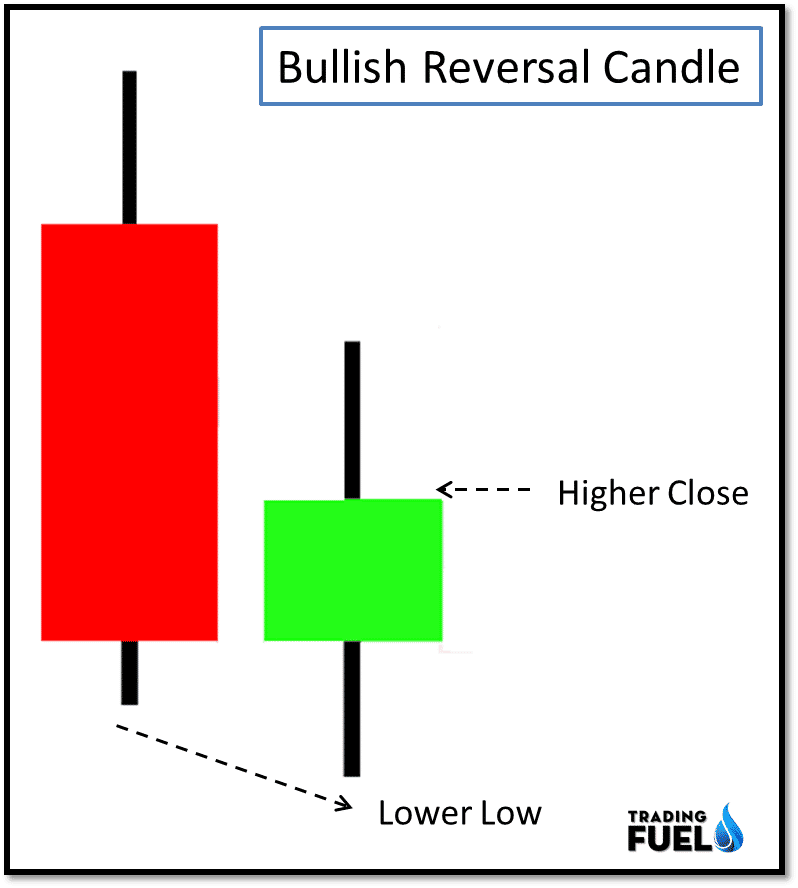
It is a two candlestick pattern.
The first candle can be a big bullish or bearish candle.
The second candle is most likely to be an indecisive candle showing rejection of price from both directions.
For bullish reversal, the second candle breaks the low of the first candle and form “lower low” and close above the previous red candle close.
For bearish reversal, the second candle breaks the high of the first candle and form “higher high” and close below the previous green candle close.
- What does it mean?
For bullish patterns, the price found support below the previous candle low, this support was so strong that it pushes the price to close higher than the previous candle close.
For bearish patterns, the price found resistance above the previous candle high, this resistance was so strong that it pushes the price to close lower than the previous candle close.
- How can we trade it?
Buy above the bullish reversal candle (second candle) in an uptrend.
Sell below the bearish reversal candle (second candle) in a downtrend.
2. Key Reversal Candlestick Patterns:
- What does it look like?
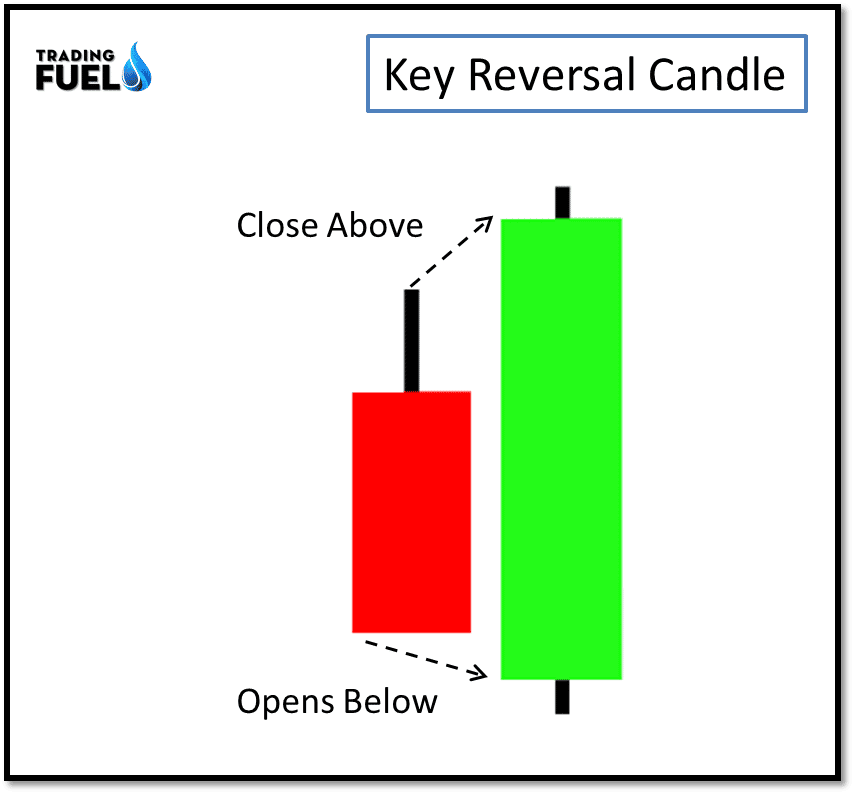
A reversal candle shows a clear sign of change in trend direction.
For the bullish reversal setup, the price opens below the previous low and close above the previous high.
For bearish reversal setup, price open above the previous high and close below the previous low.
According to the definition, the key reversal candle must have a gap up opening.
- What does it mean?
The first candle represents mass participation of the buyer and seller in a particular direction, as shown in our example the first candle was a big bearish candle which shows the participation of the seller.
The second candle opens the gap down, indicating a powerful down thrust.
As in the second candle, such a gap-down move is rejected and the price did close above the previous high.
Essentially key reversal candle hints a change of market direction.
- How can we trade it?
We can enter long trade above the high of the second candle.
For a short trade, an entry can be done below the second candle low.
3. Exhaustion Candlestick Patterns:

- What does it look like?
A bullish exhaustion candle opens with a gap down but it gets support near day’s low and finally closes near day high forming a bullish candlestick.
A bearish exhaustion candle opens with a gap up before moving down to close near day low.
In both cases, the gap remains unfilled.
- What does it mean?
As the name suggests it represents an exhaustion and trend reversal.
After the bears are exhausted the bull will take over and the market will rise.
After the bulls are exhausted the bear will take over and the market will fall.
- How can we trade it?
Buy above bullish exhaustion candle.
Sell below bearish exhaustion candle.
4. Pinocchio Candlestick Patterns:
- What does it look like?
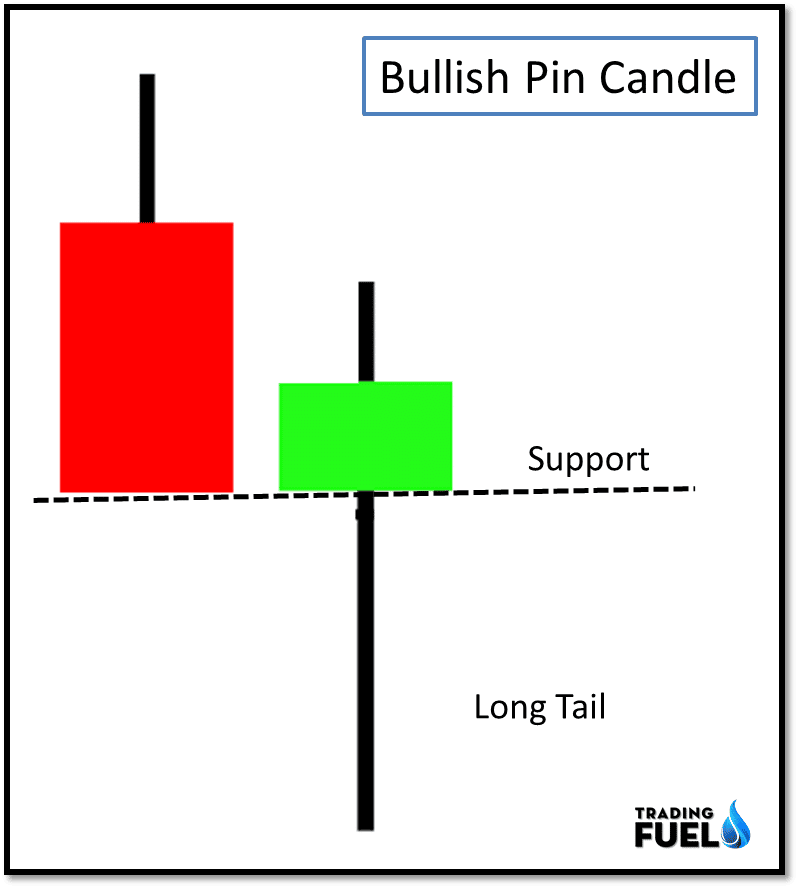
It has a long tail, it represents a rejection of price which is an indication of a possible reversal in the direction of a trend.
For the bullish pin candle, the lower tail takes up most of the candle.
For the bearish pin candle, it is the upper tail that dominates.
- What does it mean?
As it has a long tail which graphically represents a sharp rejection of price.
With a long-tail pin, candle breaks a support and resistance trick trader into entering in the wrong direction.
- How can we trade it?
Buy after a candle is close above the high of the pin candle.
Sell after a candle is close below the low of the pin candle.
5. Two Candle Reversal:
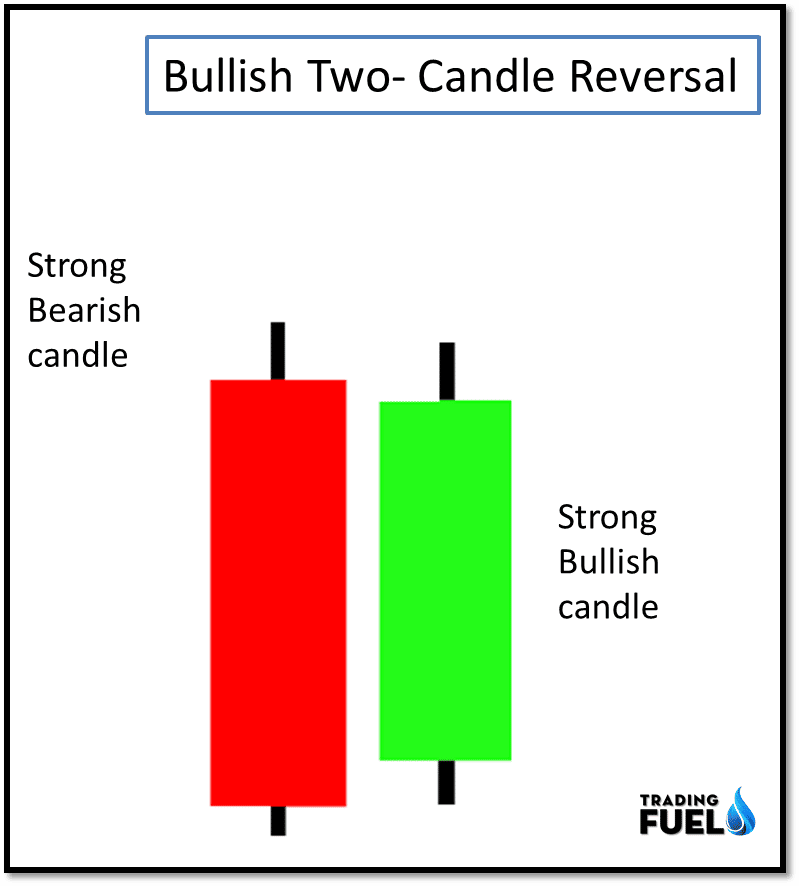
- What does it look like?
It’s made of two strong candles closing in the opposite direction.
The bullish reversal candle consists of a strong bearish candle followed by a bullish candle, reverse the order to get a bearish reversal pattern.
- What does it mean?
Every reversal pattern work on the same reaction of price, a clear rejection of the downward trend is a bullish sign.
And the clear rejection of the upward trend is a bearish reversal.
- How can we trade it?
For bullish reversal buy above the highest point of two candlestick patterns.
For bearish reversal sell below the lowest point of two candlestick patterns.
6. Three Candle Reversal:
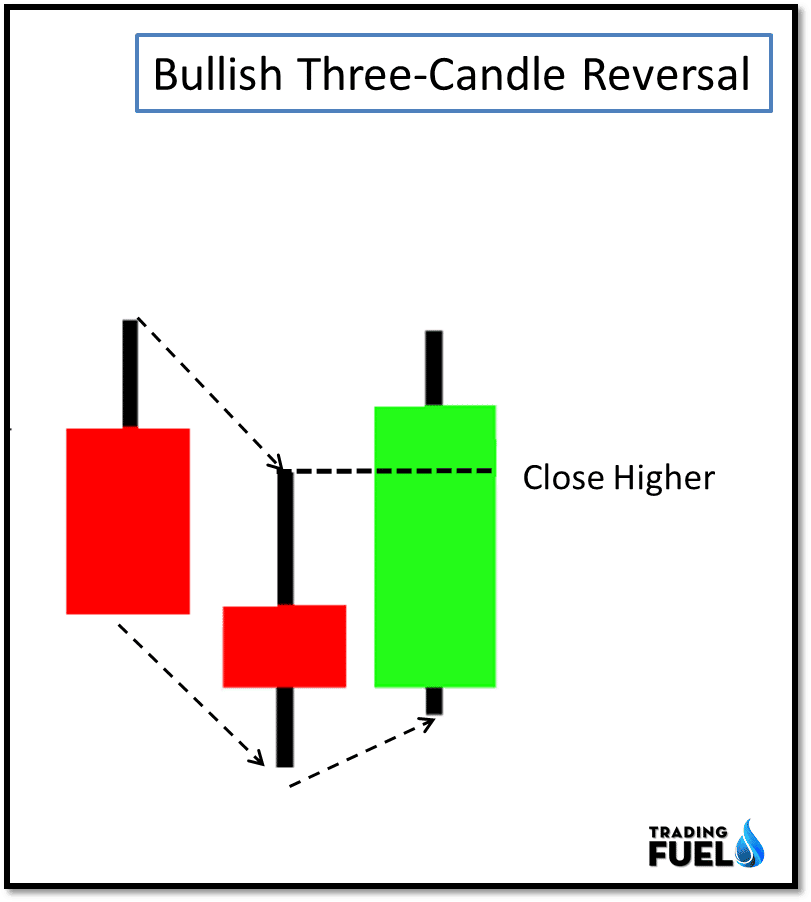
- What does it look like?
In a three bullish candle reversal patterns the sequence of a candle is:
A bearish candle
A candle has a lower high and lowers low.
A bullish candle with a higher low and close above the high of the second candle.
- What does it mean?
A three- candle reversal pattern shows a turning point, compared to other reversal patterns the three- candle reversal pattern is more accurate as it is extended over three candles. We are using the third candle to confirm that the market has changed the direction.
- How can we trade it?
Buy after a candle close above high of the second candle of the bullish pattern.
Sell after a candle close below low of the second candle of the bearish pattern
7. Three Candle Pullback:
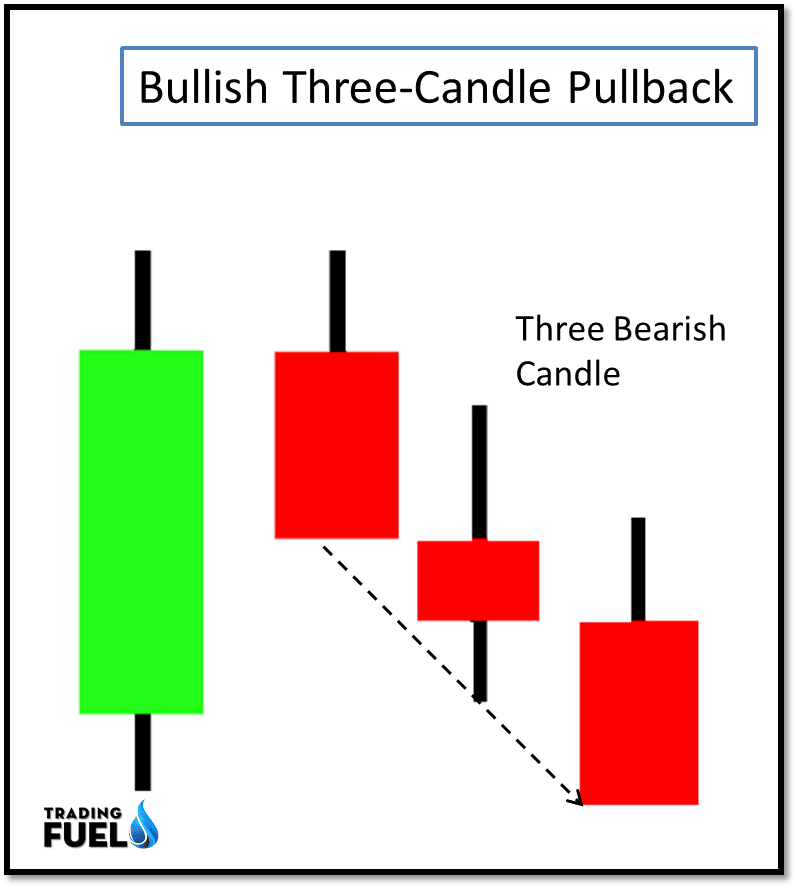
- What does it look like?
After Three consecutive bearish candles, a bullish pullback occurs.
After three consecutive bullish candles, a bearish pullback occurs.
- What does it mean?
In a trending market, counter-trend does not sustain for a longer period, so after a pullback of three candles, the main trend is ready to resume.
- How can we trade it?
Within a bull trend, wait for three bearish candles (counter trend), then buy after a candle is close above the last bearish candle.
Within a bearish trend, wait for three consecutive bullish candles, then sell below the last bullish candle.
8. Inside Candlestick Patterns:

- What does it look like?
Here the second candle has a high low and lowers high compare to the first candle.
The second candle must stay completely within the previous candle.
- What does it mean?
An inside candle is a narrow range candle, having lower volatility and lower candle range.
It is a halt in the movement form where price could start a new trend in either direction.
- How can we trade it?
Place one order according to the market direction, buys order above the previous candle high, or sell order below the previous candle low.
You can place both orders (buy order or sell order) to trade the breakout in either direction.
9. Outside Candlestick Patterns:
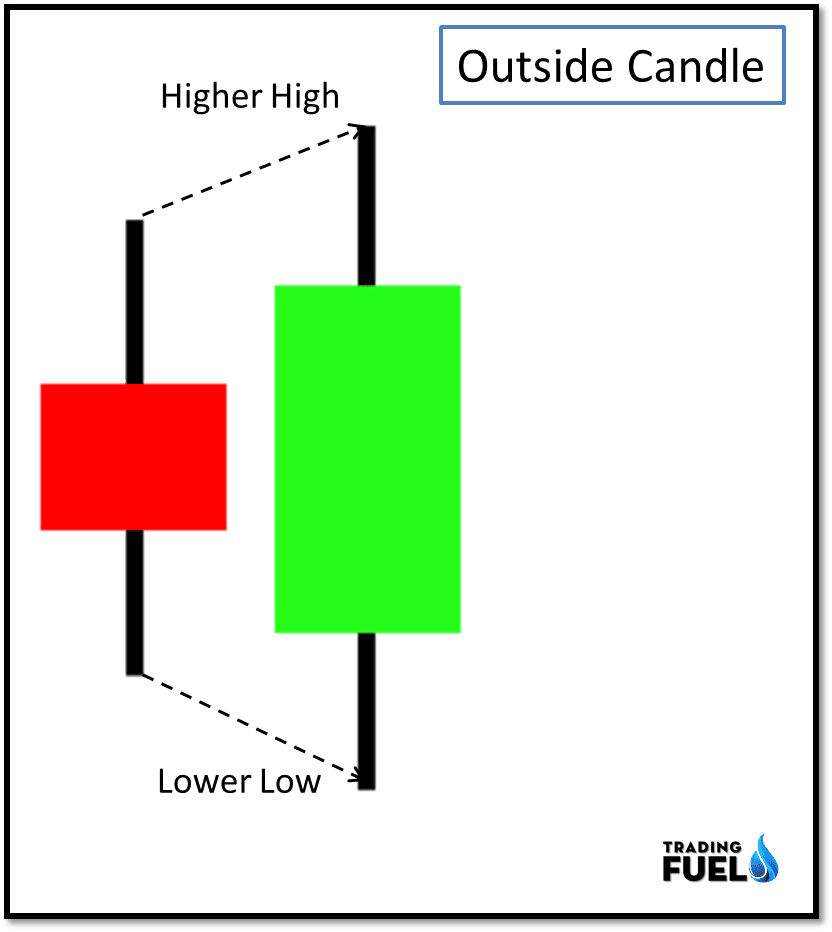
- What does it look like?
An outside candle is a two-candle pattern, in which the second candle has a higher high and lower low.
The range of the second candle must exceed the range of the first candle.
- What does it mean?
The price range and volatility expand showing strength in both the direction.
In most case it’s uncertain if the bulls or bear have won, the only certainty is the increased volatility.
- How can we trade it?
Trading outside candle is a bit risky then inside a candle, as the volatility is expanding and there is a chance that the price may run sideways movement.
One can buy or sell only after the high or low of the outside candle is broken.
10. Narrow Range 7 (NR7):
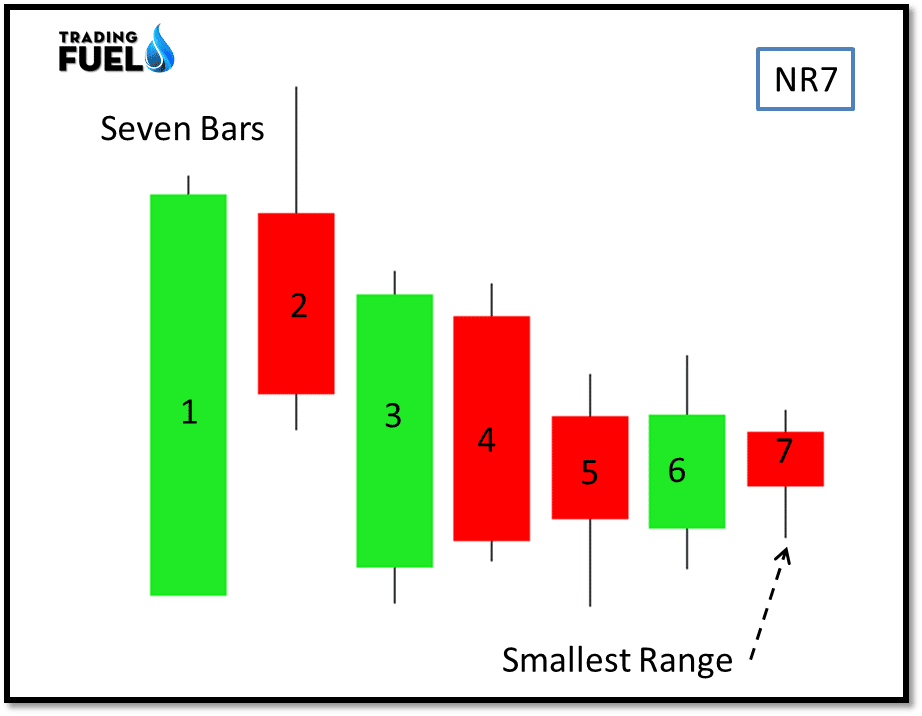
- What does it look like?
This candlestick patterns required seven candlesticks.
If the last candle has the smallest range out of the entire seven candles then it is called nr7.
The range is defined as the difference between the high and low of the candle.
- What does it mean?
As the inside candle represents the decrease in the volatility in the same way NR7 candle indicates the decrease in volatility.
NR7 does not have a specific trend, we can trade in either direction up or down.
NR7 is a strong pattern indicating a decrease in volatility.
As the market alternate between trend day and narrow day, the NR7 alert us to standby for an explosive move.
- How can we trade it?
We buy after a breakout candle closed above the high of the last candle in an uptrend.
Sell after a breakout candle closed below the low of the last candle in a downtrend.
Conclusion:
In this blog we have discussed various candlestick patterns, a candlestick pattern is a base on any price action trading strategy as they pinpoint our entry, exit, and define stop loss. Although in this blog we have seen that candlestick is also used for spotting key reversal points in the on-going trend.
For higher accuracy, it is advisable to spot such a candlestick near the support and resistance line. Once you get to read a candlestick pattern and to use a particular pattern in the trading strategy. Following a trading system would be easy as you can see the same pattern repeating itself over time.
Contain & Image ©️ Copyright By, Trading Fuel Research Lab