
How to Read Stock Chart?
its very big question for beginners. Smart traders are able to read stock chart and fetch profit irrespective of whether the market is going up or falling down or just simply moving sideways. So can you also do that by understanding simple basic chart patterns and chart analysis using real examples by Trading Fuel expert article.
What is Stock Chart?
Charts plot price and volume data in an easy and readable format which makes it easier to spot buy and sell points.
Why to Use Stock Charts?
Once you have identified the stock with strong fundamental data like sales and earnings you will need stock chart to identify the right time to buy the stock. Charts will show you whether the stock is trending up or down. Also it will help you to identify current base patterns and buy points.
Price and Volume
There are many different types of stock charts: line, bar, Candlestick, point and figure, and various others which are view-able in different time frames like daily, weekly, monthly and intraday charts. Each of the different time frame has its own advantages and disadvantages but they all give price and volume information that can be use to make profitable investing decisions.
It is said that a picture says a thousand words; this rightly stands true in the terms of technical analysis, where the whole trading statistics is plotted on a graphic representation.
A stock chart is the graphical depiction of open, high, low and close of a stock on an X and Y axis based stock chart.
X Axis represent the DURATION in minutes, Days, weeks, months and others
Y Axis represents the PRICE of the underlying

Observe the above chart and understand that it is easy to read stock chart by observing that the whole data of closing prices of a stock are plotted in a graphical presentation which gives a clear picture of the trend as compared to viewing the same data in a tabular form.
The stock charts are very easy to understand and technically possible to do all kinds of analysis. Also the future prediction can be done based on the past data.

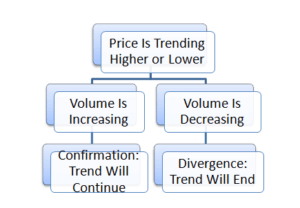
From the above chart one can see lower column of Volume which states the total number of shares traded on that particular day. Volumes help technical analyst confirm about trend that if a stock has risen with good volumes then the rally will stay for a longer time.
SUPPORT AND RESISTANCE:
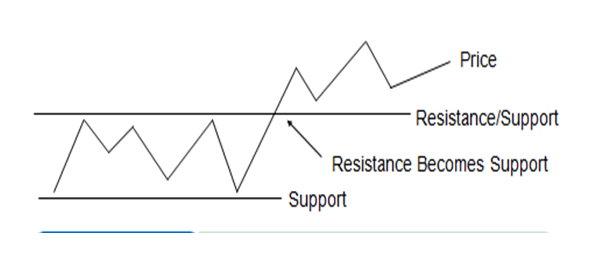
Support: A low price range in which buying activity is sufficient to stop a decline in price.
Resistance: A high price range in which selling activity is sufficient to stop a rise in price.
Change in Polarity: Once a resistance level is breached, it becomes a support level
Trend Analysis :

- Up Trend: In Up Trend, stocks prices move in upward direction. Formation is higher top and higher bottom. One should buy at every decline
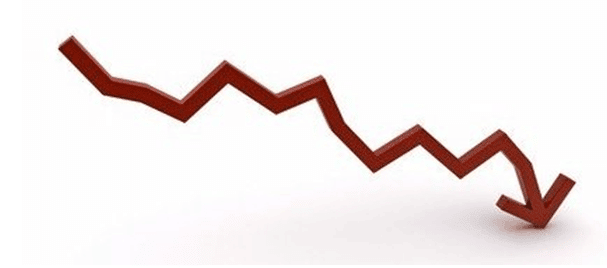
- Downtrend: In down trend, stocks prices move in downward direction Formation lower bottom and lower top. One should sell at every rise
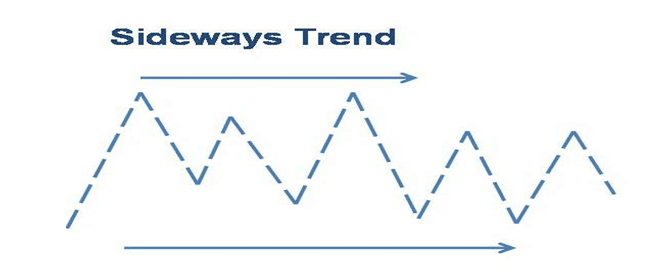
- Sideways Trend: In sideways trends, stocks prices move in narrow range neither going up wards nor down wards. Here, one should have to wait for the clear trend whether up or down.
Trend Indicators:
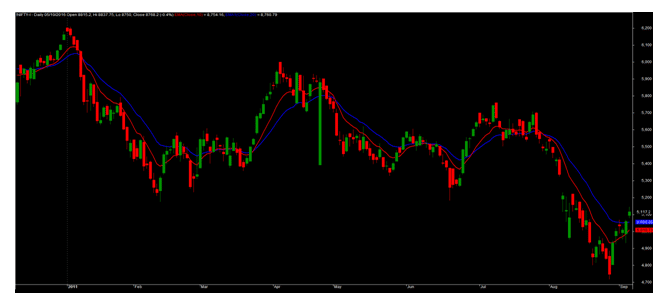
- Price Based Indicator- Moving Average
It is Simple technical analysis tool that smoothness the price data by creating constantly updated average price. The average price is taken over specific time period like 10 days, 20 minutes, 30 weeks or any time period between the traders chooses. There are various advantages of using moving average in trading as well as type of moving average.
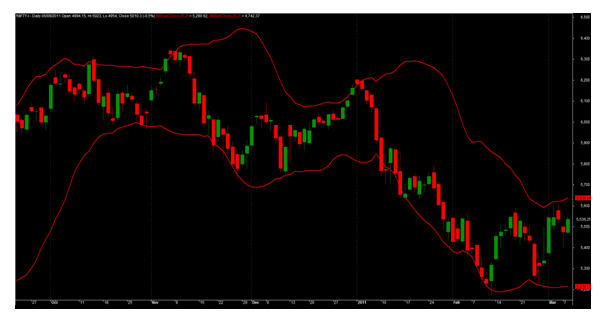
- Bollinger Band :
Bollinger Bands are a popular technical volatility indicator. They place the upper and lower bounds around the security’s price action. Since the heart of any applied Bollinger Bands is a simple moving average, these indicators make natural candidates for a moving average crossover strategy.
Use Different Stock charts of different time periods:
Technical Charts can be drawn with a specific view and timeline to take micro or macro trend analysis of stock. Here are the different time period charts.
- Daily EOD: Chart where one Candle, Bar, Dot stand for the trading of a single trading day. These charts are also known as Daily chart.
- One Minute: Chart which signify the one minute trading
- Five Minute: Chart which signify the Five Minute trading of a week.
- Intraday: A continuous tick chart which stand for the trading of that day. This chart is used by short term and Intraday traders.
- Weekly:Chart which signify the weekly trading and one bar represent the trading of a week.
- Monthly:Charts which stand for the trading of months. One month is represente by one bar.
- Quarterly:Chart which represents the trading of a one quarter( 3 months)
- Yearly: Such charts are very rarely used. It represents the year wise trading patterns, where one Bar represents one year or trading.
So a budding or smart trader you can use both EOD and Weekly data to see whether a trend confirmation has occurred on both the charts. Also you can see whether it premature to confirm a trend on the stock. More secrets about how to use stock charts for technical analysis are below.
Lastly to conclude as an analyst it is always important to keep a watch on all the time periods to get a more holistic view on a chart. Thanks for read our Blog of “ How to read stock chart?” Visit Daily for More Blog!