
Heikin Ashi:
- Heikin-Ashi charts, developed by Munehisa Homma within the 17 century.
- Heikin-Ashi some characteristics with candlestick charts but differ based on the values used to create each candle.
- In Japanese, Heikin signifies “normal” and Ashi signifies “pace”.Taken together, Heikin-Ashi means a normal pace of price.
- It indicates the trend in the market. Heikin-Ashi Candlesticks are not utilized like ordinary candles. Many bullish or bearish candlestick charts other than 1-3 candles are not to be found.
- Heikin-Ashi technique uses a modified formula supported two-period averages. This provides the chart a smoother appearance, making it easier to spots trends and reversals, but also reduce gaps and a few price data.
What Does Heikin Ashi Tell?
Heikin-Ashi Candlesticks are fundamentally the same as the standard candlestick chart, yet vary in some key highlights.
- A Heikin-Ashi candle is green when the HA-Close is over the HA-Open.
- Heikin-Ashi candles are red when the HA-Close is underneath the HA-Open.

The outline above shown with the Heikin Ashi candle.
- The blue bolts show uncertain Heikin-Ashi Candlesticks that framed with two typical candles of inverse shading. Indicating a possible weakness in the share and hint a pattern inversion.
- The red bolts show a solid decline set apart by a progression of Heikin-Ashi candles without upper shadows. This implies the Heikin-Ashi Open denoted the high.
- The green bolt shows a solid development set apart by a progression of Heikin-Ashi candles without lower shadows. This implies the Heikin-Ashi open denoted the low.
Heikin Ashi Candlestick Formula:
Heikin-Ashi Candlesticks depend on value information from
- The present open-high-low-close.
- The current Heikin-Ashi values.
- The earlier Heikin-Ashi values.
Heikin Ashi Candlesticks close, open, high and low values:
1. Close(HA) = (Open Price + High + Low +Close) / 4
2. Open (HA) = Average of Open Price and Close Price of the previous HA candle
3. High (HA) = Maximum value of the (High of the Day, Open of HA, Close of HA)
4. Low(HA) = Minimum value of the (Low of the Day, Open of HA, Close of HA)
Standard candlestick charts vs Heikin ashi charts:

You can detect a couple of contrasts between these two kinds of outlines.
- Heikin Ashi chart has a smoother look than the candle outlines.
- The Heikin Ashi candles remain red during a downtrend and green during an upswing.
- The cost on standard candle will present the current cost of share price but that is not in the case of Heikin Ashi candle.
- Heiken Ashi candle doesn’t present the current cost of the share price.
Types of candle in Heikin Ashi:
Different Candles in a Heikin-Ashi Chart:
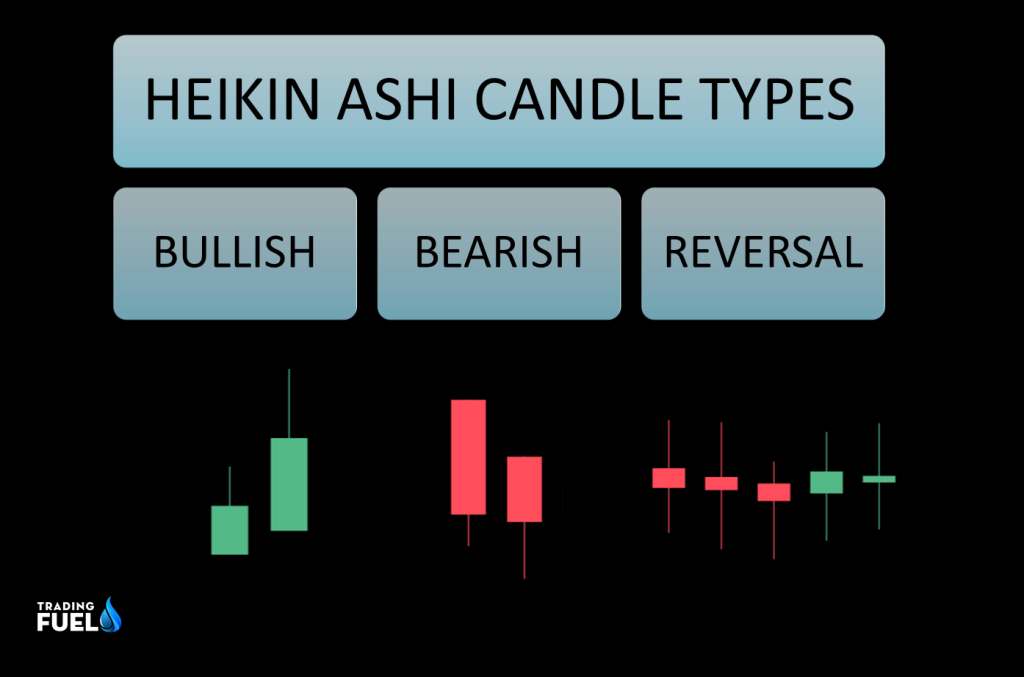
1- Bullish candles:
At the point when the market is Bullish, Heikin-Ashi candles have huge bodies and long upper shadows yet no lower shadow. Take a gander at the large upturn in the graph. As you see practically the entirety of the candles have huge bodies, long upper shadows, and no lower shadow.
2- Bearish Candles:
At the point when the market is Bearish, Heikin-Ashi candles have huge bodies and long lower shadows yet no upper shadow. Take a gander at the huge downtrend in the outline. As you see practically the entirety of the candles have huge bodies, long lower shadows, and no upper shadow.
3- Reversal Candles:
- Reversal candles in the Heikin-Ashi graphs look like Doji candles. They have no or exceptionally little bodies however long upper and lower shadows. Take a gander at the inversion candles in the beneath outline.
- Heikin-Ashi Doji and spinning tops can be used to spot reversals point in share. A Heikin-Ashi Doji or Heikin-Ashi spinning is the same as a normal Doji or spinning top. There are small shadows to denote a little narrow price movement.

Key Point:
- The drawback is that some valuable information is lost with averaging. The latest price may not mirror the real cost of the advantage, which could influence the hazard.
- Green candles imply an upturn, implies you should add to your long position, and quit your short positions.
- Candles with a little body encompassed by upper and lower shadows show weakness in the pattern.
- Red candles show a downtrend. Red candles with no higher shadows approve a solid downtrend. You should sit tight for a brief timeframe till there is a change in patterns
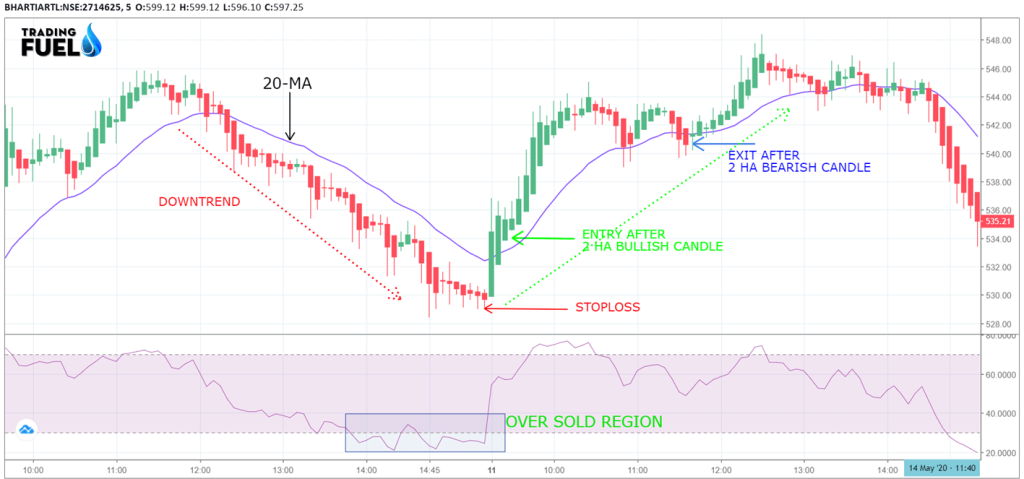
Heikin Ashi Trading Example:
Here in this example, we will use the Heikin Ashi candle in our trading setup, along with Heikin Ashi we have used 20 MA and RSI.
Buy condition:
- The trend should be in a down word direction.
- RSI must be in an oversold region.
- The price must cross 20MA from below.
Entry:
- Entry after two green Heikin ashi candle with no lower shadow.
Stoploss:
- Stoploss below the low of the 1st HA candle.
Exit:
- Exit after two bearish HA candle form.
Heikin Ashi Charts:
1. Advantage:
- Heikin Ashi graphs help to assist the strength of the fundamental move.
- Heikin Ashi candle removes the noise from the price like a gap up and gaps down.
- As Heikin Ashi is a two-day relation candlestick, it represents the momentum of the share with high accuracy and you can ride the whole trend and maximize your profit.
- As compared to standard candlestick charts, it is easy to understand as it has only three variations of candles, bullish, bearish, and indecisiveness.
- The technical indicator work way better with Heikin Ashi as most of the noise is removed.
- It is easily available in most of the charting platform.
2. Disadvantage:
- There is not much information about the Heikin Ashi candle as compared to the standard candlestick.
- Any buy/sell trading setup you might have with the standard candle, will not be applied in Heikin Ashi.
- Heikin Ashi doesn’t represent the current price of the share.
- Because of the smoothing impact of Heikin Ashi outlines, the most famous candlestick examples remain to be undetectable.
- The standard candlestick pattern is not valid in the Heikin Ashi chart.
- Even though It is derived from the standard candlestick, its method of calculation of high, low, close, and open is different, which might lead to confusion if one does not understand the basics of Heikin Ashi candles.
Heikin Ashi afl with ATR for Amibroker
// Downloaded From www.TradingFuel.com
_SECTION_BEGIN("ERO1 ATR BUY SELL");

ero1 = Param("ATR multiple", 2.8, 0.5, 10, 0.1 )*Param("ATR period", 10, 3, 50 );
ero1_col=ParamColor( "Color", colorCycle );

r=HHV(H,ero1);
s=LLV(L,ero1);
ab=IIf(H>Ref(r,-1),1,IIf(L<Ref(s,-1),-1,0));
ac=ValueWhen(ab!=0,ab,1);
sl1=IIf(ac==1,s,r);

Plot(sl1, _DEFAULT_NAME(), ero1_col, styleStaircase); // or styleaArea

Buy=Cross(H,sl1);
Sell=Cross(sl1,L);
PlotShapes(IIf(Buy, shapeSquare, shapeNone),colorGreen, 0, L, Offset=-40);
PlotShapes(IIf(Buy, shapeSquare, shapeNone),colorLime, 0,L, Offset=-50);
PlotShapes(IIf(Buy, shapeUpArrow, shapeNone),colorWhite, 0,L, Offset=-45);
PlotShapes(IIf(Sell, shapeSquare, shapeNone),colorRed, 0, H, Offset=40);
PlotShapes(IIf(Sell, shapeSquare, shapeNone),colorOrange, 0,H, Offset=50);
PlotShapes(IIf(Sell, shapeDownArrow, shapeNone),colorWhite, 0,H, Offset=-45);
_SECTION_END();


_SECTION_BEGIN("ERO2 ATR BUY SELL");

ero2 = Param("ATR multiple", 2.8, 0.5, 10, 0.1 )*Param("ATR period", 10, 3, 50 );
ero2_col=ParamColor( "Color", colorCycle );

r=HHV(H,ero2);
s=LLV(L,ero2);
ab=IIf(H>Ref(r,-1),1,IIf(L<Ref(s,-1),-1,0));
ac=ValueWhen(ab!=0,ab,1);
sl2=IIf(ac==1,s,r);

Plot(sl2, _DEFAULT_NAME(), ero2_col, styleStaircase); // or styleaArea

Buy=Cross(H,sl2);
Sell=Cross(sl2,L);
PlotShapes(IIf(Buy, shapeSquare, shapeNone),colorGreen, 0, L, Offset=-40);
PlotShapes(IIf(Buy, shapeSquare, shapeNone),colorLime, 0,L, Offset=-50);
PlotShapes(IIf(Buy, shapeUpArrow, shapeNone),colorWhite, 0,L, Offset=-45);
PlotShapes(IIf(Sell, shapeSquare, shapeNone),colorRed, 0, H, Offset=40);
PlotShapes(IIf(Sell, shapeSquare, shapeNone),colorOrange, 0,H, Offset=50);
PlotShapes(IIf(Sell, shapeDownArrow, shapeNone),colorWhite, 0,H, Offset=-45);
_SECTION_END();


_SECTION_BEGIN("ERO3 ATR BUY SELL");

ero3 = Param("ATR multiple", 2.8, 0.5, 10, 0.1 )*Param("ATR period", 10, 3, 50 );
ero3_col=ParamColor( "Color", colorCycle );

r=HHV(H,ero3);
s=LLV(L,ero3);
ab=IIf(H>Ref(r,-1),1,IIf(L<Ref(s,-1),-1,0));
ac=ValueWhen(ab!=0,ab,1);
sl3=IIf(ac==1,s,r);

Plot(sl3, _DEFAULT_NAME(), ero3_col, styleStaircase); // or styleaArea

Buy=Cross(H,sl3);
Sell=Cross(sl3,L);
PlotShapes(IIf(Buy, shapeSquare, shapeNone),colorGreen, 0, L, Offset=-40);
PlotShapes(IIf(Buy, shapeSquare, shapeNone),colorLime, 0,L, Offset=-50);
PlotShapes(IIf(Buy, shapeUpArrow, shapeNone),colorWhite, 0,L, Offset=-45);
PlotShapes(IIf(Sell, shapeSquare, shapeNone),colorRed, 0, H, Offset=40);
PlotShapes(IIf(Sell, shapeSquare, shapeNone),colorOrange, 0,H, Offset=50);
PlotShapes(IIf(Sell, shapeDownArrow, shapeNone),colorWhite, 0,H, Offset=-45);
_SECTION_END();


// Downloaded From www.TradingFuel.com
SetChartBkGradientFill( ParamColor("BgTop", colorBlack),ParamColor("BgBottom", colorBlack),ParamColor("Titleblock",colorLightGrey ));
SetChartOptions(0,chartShowArrows|chartShowDates);
GraphXSpace=5;
p=Param("Period",6,2,30,1);
Om=MA(O,p);
hm=MA(H,p);
lm=MA(L,p);
Cm=MA(C,p);
HACLOSE=(Om+Hm+Lm+Cm)/4;
HaOpen = AMA( Ref( HaClose, -1 ), 0.5 );
HaHigh = Max( Hm, Max( HaClose, HaOpen ) );
HaLow = Min( Lm, Min( HaClose, HaOpen ) );
PlotOHLC( HaOpen, HaHigh, HaLow, HaClose, "" + Name(), colorWhite, styleCandle | styleNoLabel );
_SECTION_END();


_SECTION_BEGIN("Heiken Ashi Smoothed");
SetChartBkGradientFill( ParamColor("BgTop", colorBlack),ParamColor("BgBottom", colorBlack),ParamColor("Titleblock",colorLightGrey ));
SetChartOptions(0,chartShowArrows|chartShowDates);
GraphXSpace=5;
p=Param("Period",6,2,30,1);
Om=MA(O,p);
hm=MA(H,p);
lm=MA(L,p);
Cm=MA(C,p);
HACLOSE=(Om+Hm+Lm+Cm)/4;
HaOpen = AMA( Ref( HaClose, -1 ), 0.5 );
HaHigh = Max( Hm, Max( HaClose, HaOpen ) );
HaLow = Min( Lm, Min( HaClose, HaOpen ) );
PlotOHLC( HaOpen, HaHigh, HaLow, HaClose, "" + Name(), colorWhite, styleCandle | styleNoLabel );
_SECTION_END();
Line=ParamToggle("Show Line chart also","Hide|Show",0);
if(Line==1) {
Plot(C,"Close",colorWhite,styleLine);
}


a=LinearReg(HaClose, 5 ) ;
b=LinearReg( HaClose, 5 ) ;

Plot( IIf(HaHigh>HaOpen,a,b), _DEFAULT_NAME(), colorRed, ParamStyle("Style") );

Plot( LinearReg( HaOpen, 5 ), _DEFAULT_NAME(), colorWhite, ParamStyle("Style") );

_SECTION_BEGIN("kgs 12 26 ma buy sell");


a=MA(C,3) ;
b=MA(C,15) ;

Buy = Cross( a,b );
Sell = Cross( b,a );
//Short = Sell;
//Cover = Buy;

//AlertIf( Buy, "", "MA cross BUY", 1,1+2 );

//AlertIf( Sell, "", "MA cross SELL", 2 ,1+2);

PlotShapes( shapeUpTriangle*Buy, colorWhite, 0, L, -10 );
PlotShapes( shapeDownTriangle*Sell, colorRed, 0, H, -10 );
_SECTION_END();


_SECTION_BEGIN("Price Line");


PriceLevel = ParamField("PriceField", field = 3 );

Daysback = Param("Bars Back",100,10,500,1);
FirstBar = BarCount - DaysBack;
YY = IIf(BarIndex() >= Firstbar,EndValue(PriceLevel),Null);


side = Param("side",1,0,1000,1);

dist = 0;

for( i = 0; i < BarCount; i++ )
{
if(i+side== BarCount) PlotText( "\n " + PriceLevel[ i ], i, YY[ i ]-dist[i], colorLightBlue );
}


_SECTION_END();

_SECTION_BEGIN("Magnified Market Price");
//by Vidyasagar, vkunisetty@yahoo.com//
FS=Param("Font Size",30,30,100,1);
GfxSelectFont("Arial", FS, 900, italic = False, underline = False, True );
GfxSetBkMode( colorWhite );
GfxSetTextColor( ParamColor("Color",colorYellow) );
//Hor=Param("Horizontal Position",800,800,800,800);

Hor=Param("Horizontal Position",20,20,500,20);


Ver=Param("Vertical Position",50,50,250,50);
GfxTextOut(""+C,Hor , Ver );
YC=TimeFrameGetPrice("C",inDaily,-1);
DD=Prec(C-YC,2);
xx=Prec((DD/YC)*100,2);
GfxSelectFont("Arial", 12, 700, italic = False, underline = False, True );
GfxSetBkMode( colorWhite );
GfxSetTextColor(ParamColor("Color",colorYellow) );
GfxTextOut(""+DD+" ("+xx+"%)", Hor+5, Ver+45 );
_SECTION_END();
Conclusion:
In this article we have discussed in detail the various aspect of Heikin Ashi candle, we have also explained its advantage and disadvantage to you.beforing using any indicator or any strategy you must understand it deeply. There are a lot of other variables of trading that can’t be explained or analyzed by a single indicator so it is important to understand the broader concept of technical analysis before applying any strategy related to any indicator.
Contain & Image ©️ Copyright By, Trading Fuel Research Lab