
The Commodity Channel Index (CCI) was developed by Donald Lambert in 1980. As per the name CCI, originally it was used to analyse commodities.
It is an oscillator indicator that helps to identify cyclical trends in security. When the CCI Line will oscillate above and below the zero lines, it gives signals for oversold and overbought market periods, like the other momentum indicators.
The default setting for the CCI indicator is 14 periods, if you set the shorter time period, the number of signals and sensitivity of the indicator will increase.
How to trade using the CCI Indicator?
Now Traders have begun to use the CCI only to trade commodities but also for stocks as well. CCI gives the signal for oversold is – 100 and overbought +100.
You can look for divergences in the CCI and also the price trend, trend line breaks of the CCI indicator gives good result.
Commodity Channel Index (CCI) Formula
The CCI indicator is plotted according to the following calculation:
CCI = (0.015 ×Standard Deviation) / (Typical Price – SMA)
Here,
- Typical Price = the arithmetic mean of any candle minimum, maximum and close values.
- SMA = it is a simple moving average that is plotted by typical prices within a given period.
- 0.015 = determined constant.
- Standard Deviation = it is a simple moving average plotted by value (Typical Price – SMA).
- Note: The period for the moving average is always fixed.
Commodity Channel Index (CCI) + Moving Average Strategy
In this strategy, you need to add a simple moving average with the 100-period setting – with the CCI indicator, which improves the quality of the signal and to get trading efficiency.
This strategy is suitable for short-term trading. And 15-minute is the ideal time frame to trade.
The moving average will be reacting as a support/resistance line in this strategy.
For Buy Trade:
When CCI comes out from the oversold zone and also checks that the price line should intersect the moving average chart from below.
If the above condition is satisfied, you can go to buy trade.
For Sell Trade:
When CCI and come out from overbought zone (i.e. crosses the +100 level, from below) and also check that the price crosses the moving average in the same direction.
If you find this setup in the chart you can go for sell trade.
From the below example, we can see that the buy entry is triggered when the price line crosses the moving average and the CCI comes out from the oversold area.

Commodity Channel Index (CCI) + Stochastic RSI Trading Strategy
According to CCI + SRSI trading strategy, first, from both indicators, you need to get matching signals like overbought/oversold signals, divergences, or trend breakouts.
Use the default setting for CCI and Stochastic RSI
Whenever you get a signal in the same direction from each of the indicators you should follow the direction of the respective signal (short or long).
For Buy Trade:
For buy trade, when both indicators give, positive divergence or oversold signal or trend breakout, you can go for the buy trade.
But both indicators should give the same signal at the same time.
For Sell Trade:
When both the indicator gives the same signal to sell trade you can open your short trade. The sell signal may be a negative divergence, overbought signal or it may be a trend breakout signal.
You should exit your trades whenever the CCI or the SRSI gives you an opposite direction signal.
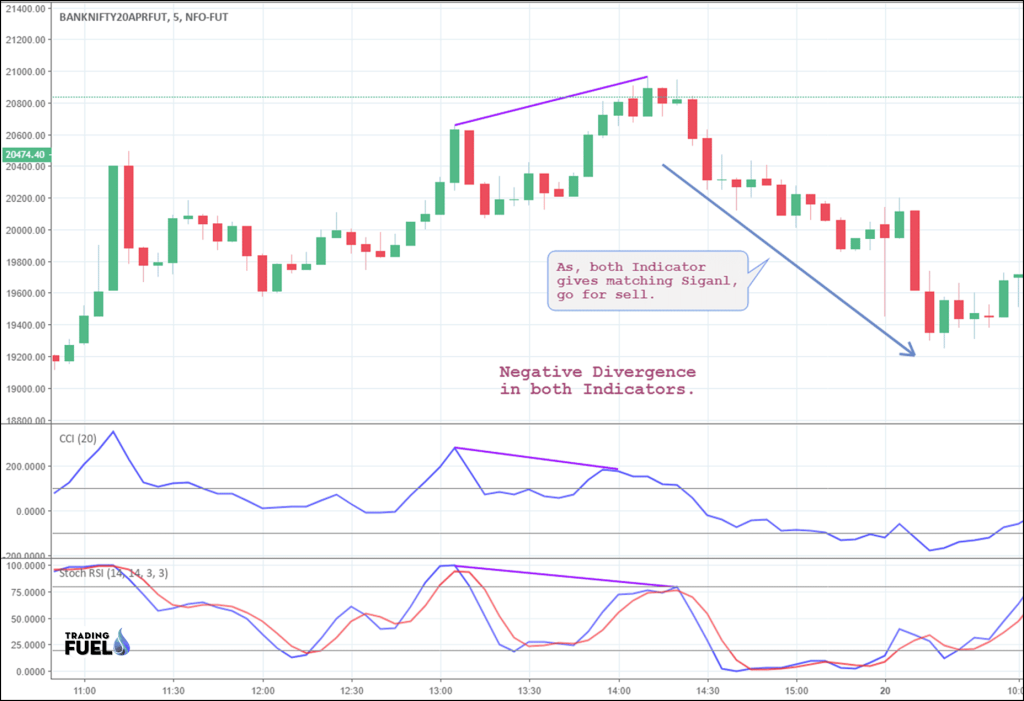
Form this example, you can see that at the same time both indicator gives sell signal as there is negative divergence.
CCI – Commodity Channel Index | Amibroker AFL
periods = Param( "Periods", 14, 2, 200, 1 );
Plot( CCI( periods ), _DEFAULT_NAME(), ParamColor( "Color",  colorCycle ), ParamStyle("Style")  );
Advantages and Disadvantages
- The Commodity Channel Index is an effective and reliable indicator, but it has its cons as well.
- It gives good and effective signal especially in combination with the other indicators.
- When there is a strong trend, CCI moves very fast from +100 to -100 zone and vice versa, and if you use it is perceived as a reversal signal, there are chances of losing the profit from the original position.
- However, it is not a good idea to trade using only The Commodity Channel Index indicator, because CCI is just like the majority of oscillators and the use of any single Indicator gives only 30-35% accuracy.
About Us:
We provide free education to beginners and experts, and to provide more and more knowledge we regularly update Trading Fuel with different blogs and articles with different strategies.
We are not responsible for any profit or loss made using these strategies. It is only for educational purposes.