
Candlestick Reversal Patterns ( Part 2 ) :
1. Hammer and Hanging Man
Hammer and hanging man candle are the candles which have a short real body with no or little upper shadow .they both have a long lower shadow, the only difference between them is that the hammer comes at the end of a downtrend whereas the hanging man comes at the end of the uptrend.

You also like: Part 1
How to trade a hammer?

The hammer is a bullish candlestick reversal patterns that form after a decline it is named because it’s long-tail indicating the hammering of the bottom, as the seller is trapped because of the fresh buying occur during that period.
During a downtrend, a hammer formation at the bottom signals that the bottom is near price will start rising again.
The long lower shadow of the hammer indicates that the buyer was able to overcome this selling pressure and close near the open.
Confirmation signal
For trading decisions, we need more bullish confirmation before place a buy order. Once the black or green candle closes above the open hammer candle to the right side we can place a buy order.
Criteria:
The long lower shadow is two or three times of the body.
Little or no upper shadow.
The real body is near the high of the candle
The red/green, body-color can be anyone.
Low hammer work as an important support for the future.
2. The Hanging Man:

The hanging man is a bearish candlestick reversal patterns that mostly occurs at the end of an uptrend, or near a resistance zone.
After a series of higher high and higher low, the formation of a hanging man indicates that selling pressure is beginning to outcome buying pressure.
The long lower shadow indicates the presence of the seller, as they were able to push the price lower but a good recovery comes from the buyer, this action indicates the presence of the seller.
This should set off alarm since hammer formation tells us that there is no new buying, and the seller is getting the upper hand as a result of which the price lacks the necessary momentum.

Criteria:
- A long lower shadow is more than two or three times of the body.
- Little or no upper shadow.
- The real body is near the trading session high.
- The color is irrelevant, but the red candle is more powerful.
3. Shooting Star:

The shooting star is a bearish candlestick reversal patterns that occur or valid during uptrend means when the price has been rising.
Its shape indicates that the worth opened at its low, rallied but pulled back to rock bottom.
This means that buyer attempted to push the worth up, but the seller came in and overpowers them. This is often a particular bearish sign since there are not any more buyers left because they need all been murdered.
This can be a black or white body when a shooting star appears during an uptrend, it can signal a bearish reversal.

4. Inverted Hammer:
The shooting star and inverted hammer look similar in shape. The only difference between them is whether they form in a downtrend or uptrend.
Both candlesticks have small little bodies long upper shadows and small or lower shadows.
The inverted hammer occurring after a series of downtrend suggests the possibility of a quick reversal.
Its long upper shadow shows that buyer tried to bid the price higher. The buyer managed to close the session near the open. And the seller wasn’t able to close the price any lower, this is a good indication that everybody, while wants to sell, has already sold.
It is exact opposite of the shooting star except it is found after a downtrend.
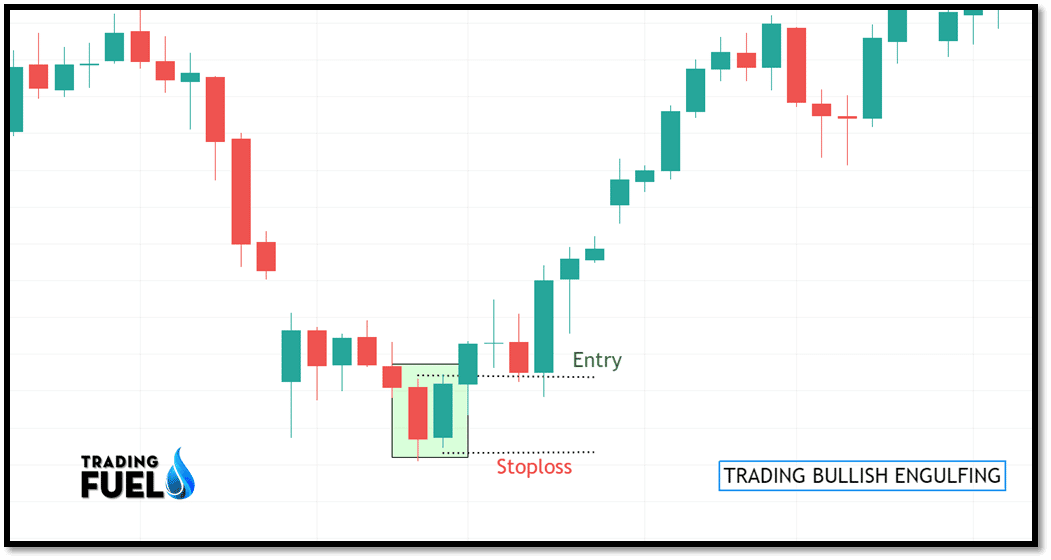
5. Bullish Engulfing:
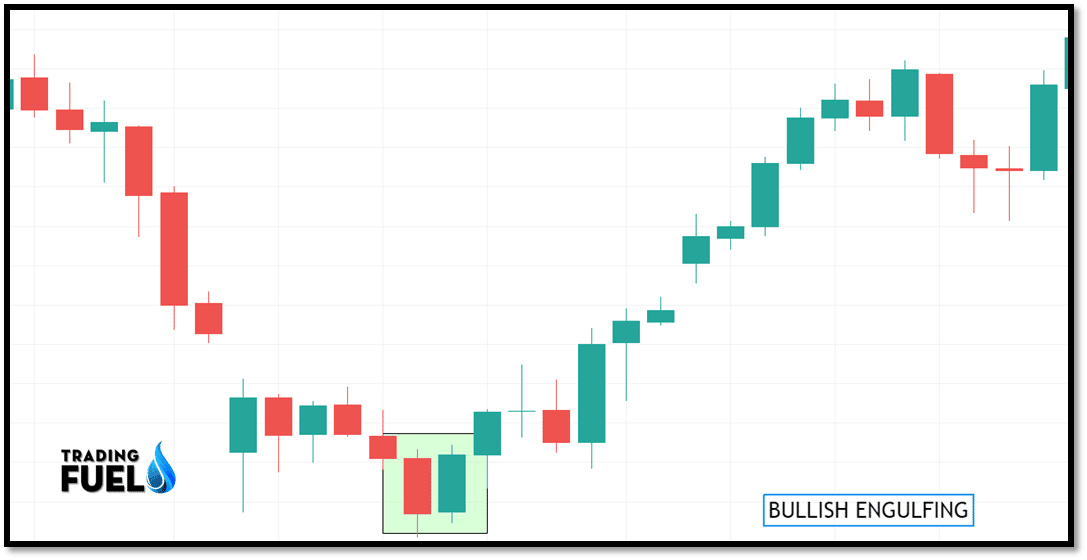
The bullish engulfing patterns are a two candlestick reversal patterns.
That signals a strong up move May becoming.it happens when a bearish candle is immediately followed by a larger bullish candle. This second candle engulfs the bearish candle.
This means that the buyer is overcoming the seller pressure and after the second candle closes above the first candle close. The buyers have successfully overcome the seller, and this could be the start of a new uptrend.
6. Bearish Engulfing:

The bearish engulfing patterns it’s the exact opposite of the bullish candlestick reversal patterns in this type of pattern a bullish candle is followed by a must stronger bearish candle that completely engulfs the prior bullish candle, this means that the seller overpowers the buyer and that a strong move down could happen.

7. Morning Star:
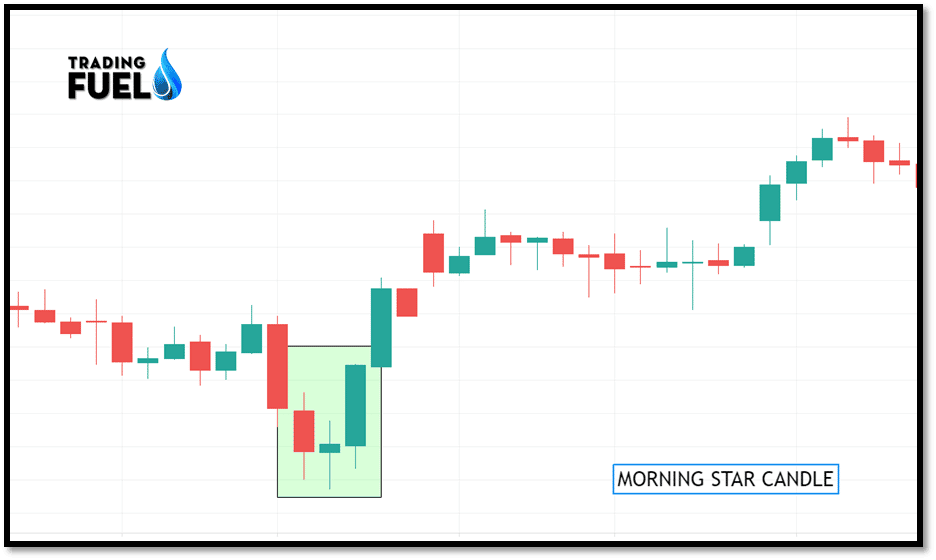
When found in a downtrend these patterns can be an indication that a reversal in the price trend is going to take place.
What the patterns represent supply and demand point of view is a lot of selling in the period which forms the first black candle.
Then a period of lower trading but with a reduced range which indicates indecision in the market this form the second candles.
This is followed by a large green candle represent the buyer taking control of the market.
The morning star pattern occurs after a downtrend, where the first candle is a big red candle indicating the continuation of the trend. The next day a Doji form indicating the indecisiveness of the seller. The third candle is a large green candle that completes the reversal. Note how the third candle recovered to the highs of the first day and occurred on strong volume.

8. Evening Star:
When found in an uptrend these patterns can be an indication that a reversal in the price trend is going to take place.

Then a period of lower trading but with a reduced range which indications indecision in the market this form the second candle.
The evening star pattern occurs in an uptrend. The first-day candle has a long green body. The bulls appear to have full control. On the second day, however, a Doji candle occurs. For this to be a valid evening star pattern, the stock open must gap down and a clear bearish candle form.

- Candlestick reversal patterns can be more effective tools if used with other indicators.
- Use a candle pattern to confirm price reversal.
- Each candle shows the force of buyers and sellers.
- Before analysis, any candle always checks the previous trend.
- Capture candle psychology on each support and resistance level.
Conclusion:
This blog covers the few candlestick reversal patterns, we have discussed in detail the various candlestick pattern their interpretation, and their trading technique. Correct knowledge of the candlestick pattern in congestion with confirmation signal, technical indicators like RSI, Stochastic, and MACD AND Moving Averages will filter out the bad trade setup and allow you to enter into high probability trade setup. Along with a strong technical indicator, one must adapt strong risk management for long term profitability.
For Free Live Chart
Contain & Image ©️ Copyright By, Trading Fuel Research Lab