The 3 Bar Reversal Pattern is a commonly used technical analysis pattern in the stock market that signals a potential change in the trend of a stock. Here’s a brief overview of the pattern and what it means for traders.
What is the 3 Bar Reversal Pattern?
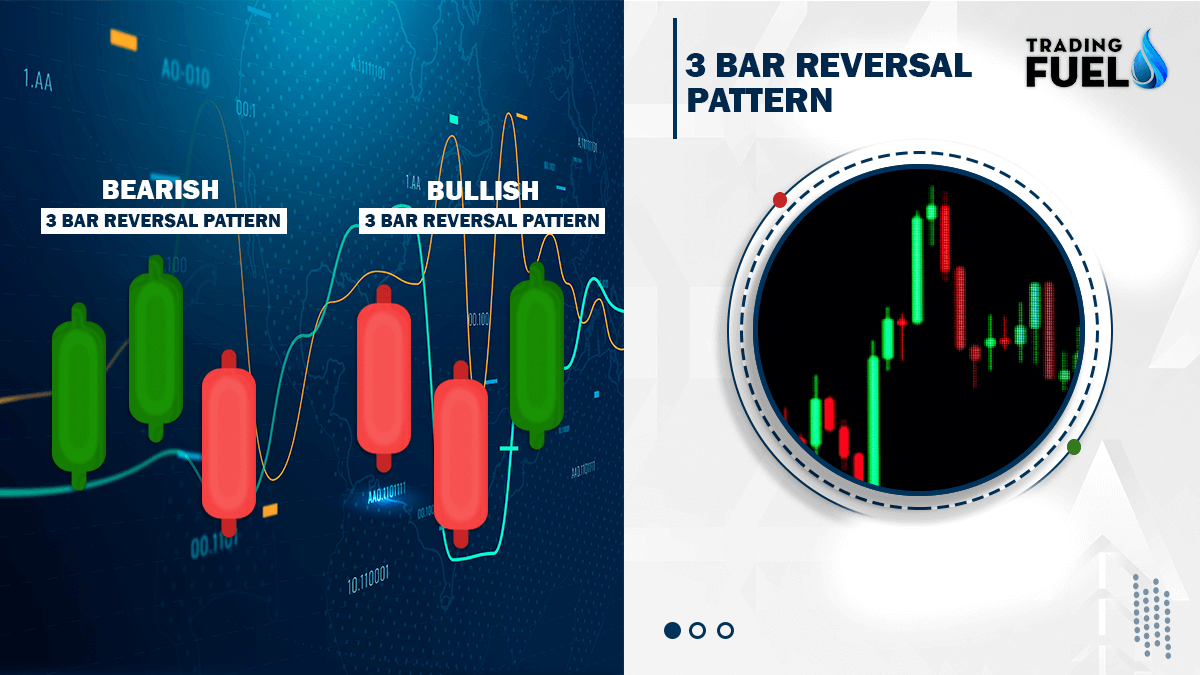
The 3 Bar Reversal Pattern is a simple, yet effective pattern that consists of three price bars. The first bar is a bullish or bearish bar that sets the trend for the following two bars. The next bar is a smaller bar that moves in the opposite direction of the first bar, and the third bar is another larger bar that confirms the reversal by moving in the same direction as the first bar.
It is formed by three consecutive price bars where the first bar is a trend continuation bar, the second bar is a counter-trend bar, and the third bar confirms the reversal by closing in the direction opposite of the trend. Traders use this pattern to identify potential trend reversals and make buying or selling decisions.

What does it signal?
The 3 Bar Reversal Pattern signals that a trend reversal is likely to occur. If the first bar is bullish, then the pattern signals a potential bearish reversal and vice versa. This makes it an important tool for traders looking to identify potential trend changes and helps them make informed trading decisions.
This pattern can be used in different time frames and markets, including stocks, forex, commodities, and cryptocurrencies. Some traders may use other technical indicators, such as moving averages or oscillators, in combination with the 3-bar reversal pattern to confirm a trend reversal and make more informed trading decisions.
You also like: NR7 Bar Scanner and Strategy
How to trade using 3 bar reversal patterns?
FOR SELL:
The pattern consists of three price bars/candles with the following characteristics:
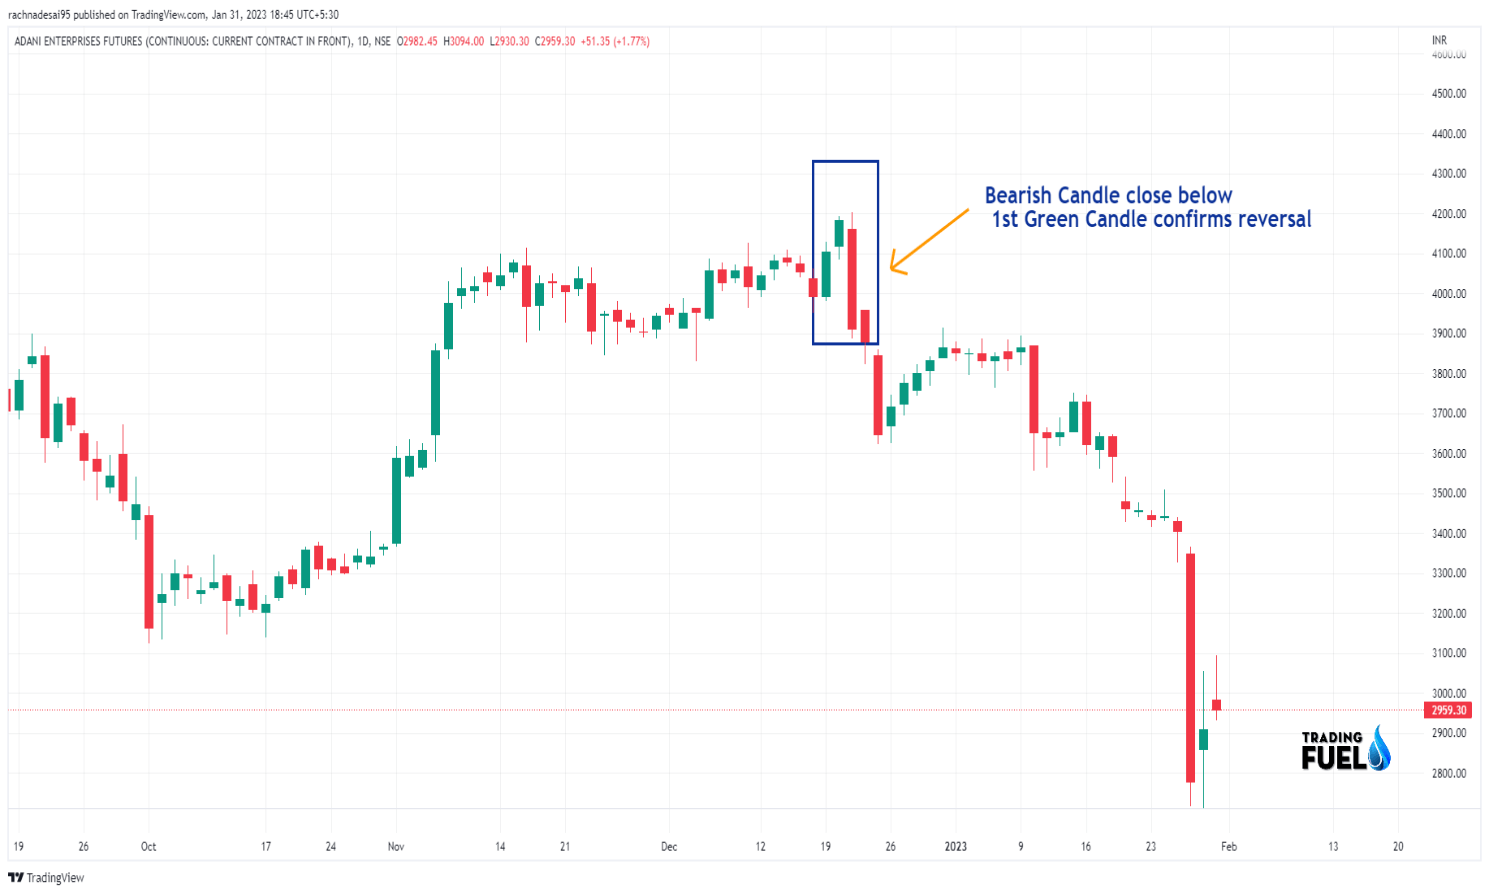
- The first bar is a long bullish (green) bar that establishes an uptrend.
- The second bar is also a bullish bar that is contained within the first bar.
- The third bar is a long bearish bar that confirms the trend reversal by closing below the low of the first bar.
You also like: Top 10 Intraday Trading Techniques & Strategies
FOR BUY:
The 3-bar reversal pattern can also indicate potential buying opportunities for traders. The pattern consists of three price bars/candles with the following characteristics:
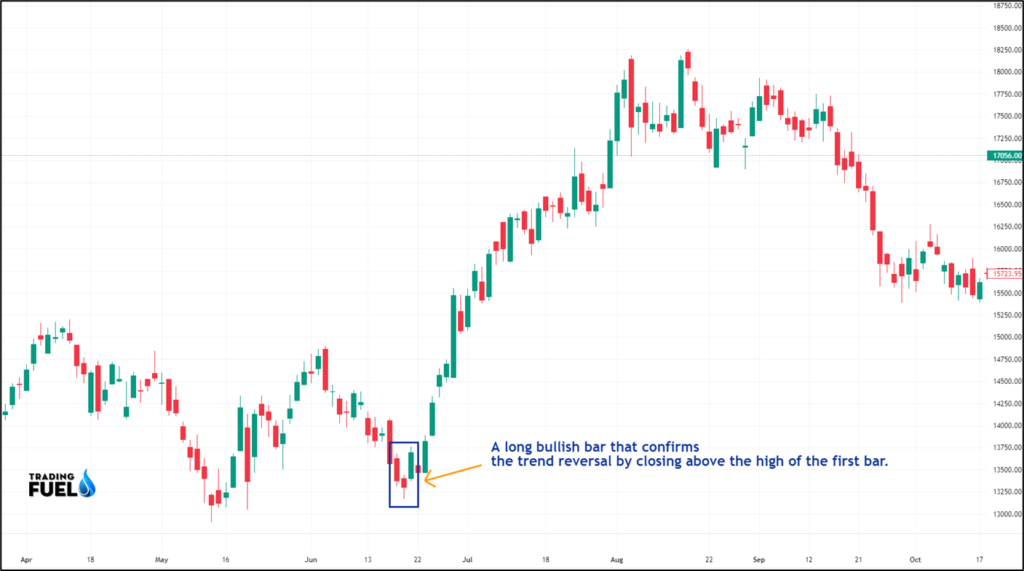
- The first bar is a long bearish (red) bar that establishes a downtrend.
- The second bar is also a bearish bar that is contained within the first bar.
- The third bar is a long bullish bar that confirms the trend reversal by closing above the high of the first bar.
Traders typically use this pattern to identify potential short-selling opportunities, as the formation of the pattern may indicate that the trend is reversing from bullish to bearish.
Download 3 Bar Reversal Pattern for Amibroker (AFL)
// Downloaded From https://www.TradingFuel.com
_SECTION_BEGIN("3 bar reversal -eliminates time");


 SetBarsRequired(10000,10000);

// initialize first element
NumBar = 0;
LastHigh=Close[1];
LastLow=Close[1];
LastStartHigh=Close[1];
LastStartLow=Close[1];

// Loop to produce the TLB values

for( i=1; i<BarCount-1; i++ )
{
if (numbar > 3 )
{
	M1=Max(TLBCB[numbar],TLBCE[numbar]);
	M2=Max(TLBCB[numbar-1],TLBCE[numbar-1]);
	M3=Max(TLBCB[numbar-2],TLBCE[numbar-2]);
	m4=Max(m1,m2);
	LastHigh=Max(m4,m3);

	M1=Min(TLBCB[numbar],TLBCE[numbar]);
	M2=Min(TLBCB[numbar-1],TLBCE[numbar-1]);
	M3=Min(TLBCB[numbar-2],TLBCE[numbar-2]);
	m4=Min(m1,m2);
	LastLow=Min(m4,m3);
}

if( Close[i]> Lasthigh)
	{
	numbar++;
	TLBCB[numbar]=LastStartHigh; // TLBCB Three Line Break Chart Begin (of bar)
	TLBCE[numbar]=Close[i]; // TLBCB Three Line Break Chart End (of bar)
	LastStartlow=LastHigh;
	LastHigh=Close[i];
	LastStartHigh=Close[i];
	}

if( Close[i]< LastLow)
	{
	numbar++;
	TLBCB[numbar]=LastStartLow;
	TLBCE[numbar]=Close[i];
	LastStartHigh=LastStartLow;
	Lastlow=Close[i];
	LastStartlow=Close[i];
	}

} // for

// move the chart to right end of chart space, ie last brick on last bar
//position
delta =  BarCount-1 - numbar;

TLBCB = Ref( TLBCB, -delta );
TLBCE = Ref( TLBCE, -delta );

rO = TLBCB;
rC = TLBCE;
rH = Max(rC,rO);
rL = Min(rC,rO);

// plot chart
PlotOHLC( rO, rH, rL, rC, "TLB" , colorBlack, styleCandle);
GraphXSpace=1;

Title = Name() + " - {{INTERVAL}} {{DATE}} - TLB Chart : ";
_SECTION_END();
In conclusion,
The 3-bar reversal pattern can be a useful tool for traders looking to identify potential trend reversals, but it should be used in conjunction with other technical analysis methods and a thorough understanding of market conditions. It is also important to remember to always practice risk management strategies and to never invest more than you can afford to lose.
Contain & Image ©️ Copyright By, Trading Fuel || Research Lab