Volume-Weighted Moving Average (VWMA) Indicator:- VWMA stands for “Volume-Weighted Moving Average.” It is a type of moving average that gives more weight to the closing prices of a security that has had a higher trading volume.
This is in contrast to a simple moving average, which gives equal weight to each closing price in the calculation. The VWMA is used by traders to identify trends and potential buying or selling opportunities in security.
Volume-Weighted Moving Average (VWMA) is a technical indicator that gives more weight to the closing prices of a security that has had higher trading volume. This is in contrast to a simple moving average, which gives equal weight to each closing price in the calculation.
Calculation of VWMA
The VWMA is calculated by multiplying the closing price of each period by the volume for that period and then dividing the sum of these values by the sum of the volume for all periods.
This results in a moving average that is more responsive to changes in the volume-weighted closing price of a security.
Use of VWMA
Traders and investors use the VWMA as a way to identify trends and potential buying or selling opportunities in security. The VWMA can be used to confirm the direction of a trend, as well as to identify potential reversal points.
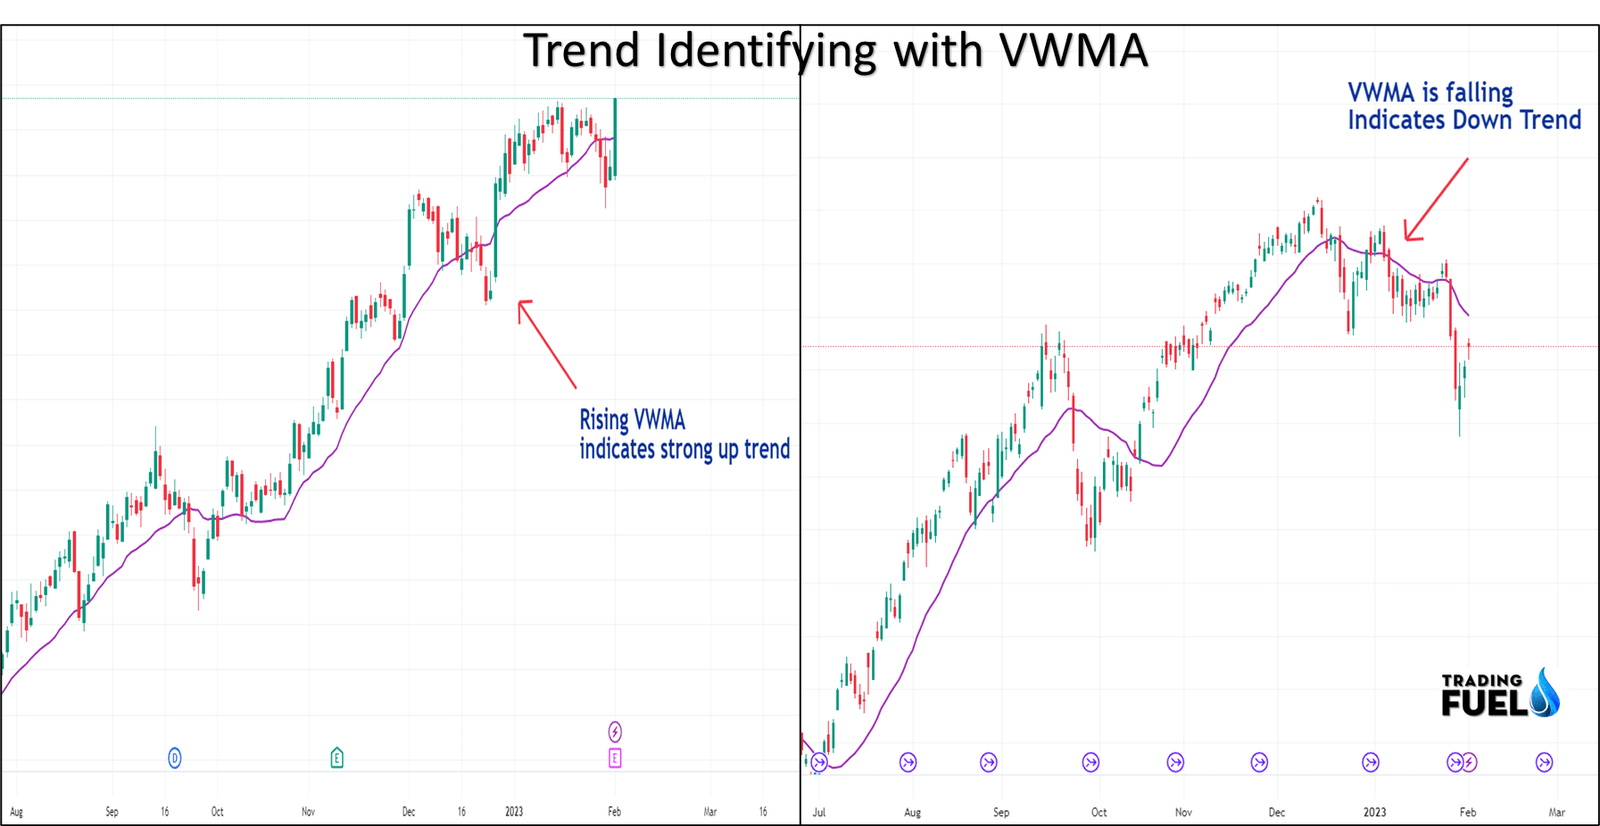
For example, if the VWMA is rising, it may indicate that the security is in an uptrend and that there is strong buying pressure. Conversely, if the VWMA is falling, it may indicate that the security is in a downtrend and that there is strong selling pressure.
One of the advantages of using the VWMA is that it takes into account the trading volume, which can provide additional information about the strength of a trend or the potential for a reversal. This is because a high volume is usually associated with a strong trend, while a low volume can indicate a lack of interest in security.
The VWMA can also be used in conjunction with other technical indicators, such as the Relative Strength Index (RSI) or the Moving Average Convergence Divergence (MACD), to provide a more complete picture of the market.
How to Use VWMA?
The Volume-Weighted Moving Average (VWMA) is a technical indicator that can be used in a variety of ways to help traders and investors identify trends and potential buying or selling opportunities in security. Here are a few steps on how to use the VWMA indicator:
- Add the VWMA indicator to your chart: Most charting platforms, such as Trading View or Meta Trader, have the VWMA indicator built-in. Simply add the indicator to your chart, and you will be able to see the VWMA line plotted alongside the security’s price.
- Choose a time frame: The VWMA can be applied to different time frames, such as daily, weekly, or monthly charts. Choose a time frame that is appropriate for your trading or investment strategy.
- Identify trends: The VWMA can be used to confirm the direction of a trend. If the VWMA is rising, it may indicate that the security is in an uptrend and that there is strong buying pressure. Conversely, if the VWMA is falling, it may indicate that the security is in a downtrend and that there is strong selling pressure.
- Look for crossovers: Another strategy is to use the VWMA in conjunction with other moving averages, such as the simple moving average (SMA) or the exponential moving average (EMA). When the VWMA crosses above the SMA or EMA, it can be a signal to buy, while a cross below can signal to sell.
You also like: Top 3 Intraday Trading Strategies
In the below example, we have taken 200 EMA and VWMA regular parameters. The time frame is 15 min for day trading.

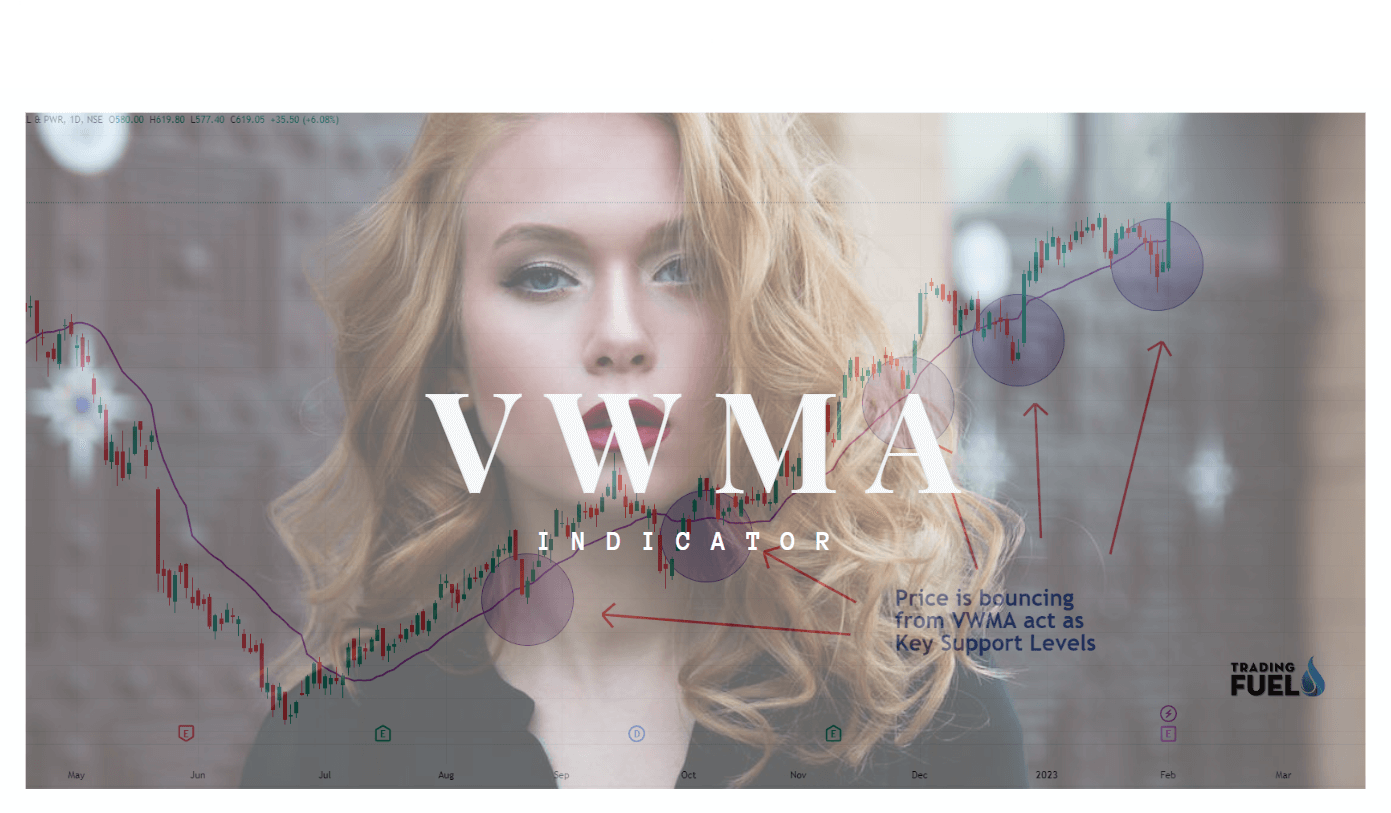
- Identify support and resistance levels: The VWMA can also be used to identify levels of support and resistance. When the price of a security bounces off the VWMA, it may indicate that the VWMA is acting as a support or resistance level.

- Watch for divergence: Traders can also look for divergence between the VWMA and the security’s price. If the price is making new highs while the VWMA is not, it may indicate that the trend is losing momentum and that a reversal is imminent.
It’s important to note that these strategies should be used in combination with other technical analysis, fundamental analysis and market sentiment. Traders should also have a proper risk management plan and be aware of market conditions.
Download VWMA For Amibroker (AFL)
// Downloaded From https://www.TradingFuel.com
SetChartBkGradientFill( 54, 54 );

function VWMA( price, pds )
{
    aa = Sum( ( Volume * price ), pds );
    bb = Sum( Volume, pds );
    Cc = aa / Nz( bb );
    return Cc;
}

pr = ( 2 * Close + High + Low ) / 4;

Plot( Close, "Close", 1, 64 );
Plot( VWMA( pr, 8 ), "Close", 29, 5 );
In conclusion,
the Volume-Weighted Moving Average (VWMA) is a technical indicator that gives more weight to the closing prices of a security that has had higher trading volume. It is a useful tool for traders and investors to identify trends and potential buying or selling opportunities in security, and it can also be used in conjunction with other technical indicators for a more comprehensive market analysis.
Contain & Image ©️ Copyright By, Trading Fuel || Research Lab