
The TradingView is A Powerful Charting System for Trader of All Experience Level. It Provides Social Networking For People To Share Their Idea Script. It Is One Of The Most Advanced Web-Based Trading Platform Offering Leading Charting Tools And Provide Latest Indicators, We Will Show You How To Use Online Platform Of TradingView in India. How It Can Enhance Your Technical Skill And Its Basic Layout.
What We Will Learn In This Article:
- The Trading View Platform.
- Make Use Of Drawing Tool.
- Create Profile And Template, Their Use.
- How To Use Advanced Charting Tool.
- Unique Feature of Trading View.
The Trading View Platform

TradingView Platform Overview:
When You First Logged In To in.Tradingview.com Above Window Will Open. In This Window You Will Get Trading Ideas Shared By Other Trader and There Use Of Technical Theory’s, You Will Find Live-Ticker Of Nifty, Commodity, Currency At The Top. Also, You Will Get Updates Of Global And Local Market Index, Data Regarding Other Active Security. There Is A Separate Section Here Which Cover Local And International News And Provide You Easy Access To Such Valuable Information. Login now
To Open An Account With Trading View, You Can Sign Up Using Your Google Account Easily So That It Could Save All The Work You Do In Chart, And Your Studies And Make It Available Next Time.
Especially For A Novice Trader Who Is More Interested In Learning Technical Aspect Of Trading, He Can Do So By The Help Of “Ideas” Section Where He Can Watch Other Trader Setup And Learn From Them. Along With This The More Advanced Trader Can Make Use Of The “Scanner” Easily, To Find His Trade Setup. In Conjunction With These, There Are Several Useful Links Available For Trader.
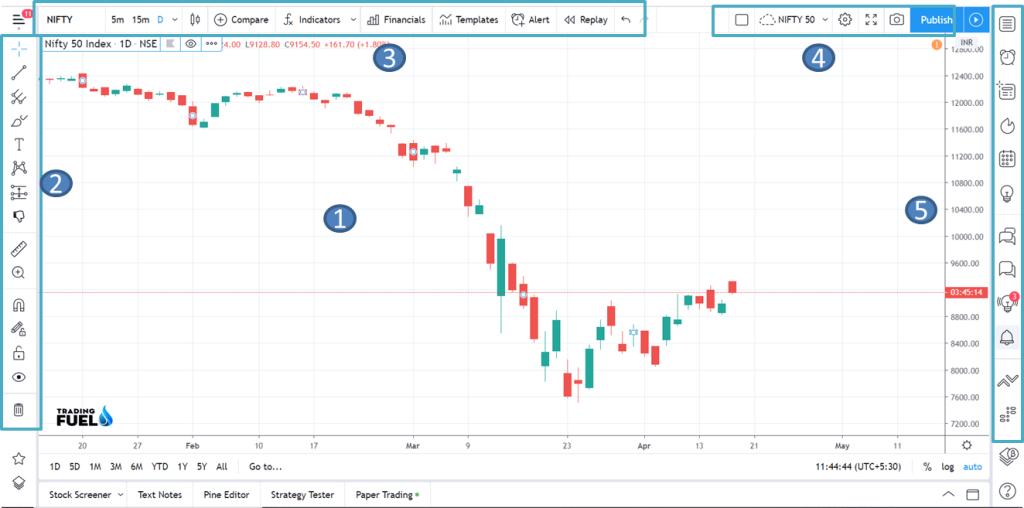
When You Open Chart Section In Trading View, Such A Window Will Open. Here We Will Discuss In Short About The Various Section And There Uses:
- The Middle Area Is For Price Chart(1). At Top You Have A Menu(3)That Allows You To Change Time Frame, Chart Type Apply Indicator, Create Price Alert And Compare Different Charts.
- On The Left Side, You Have A Charting Tool(2).
- To Switch Between Different Layout Or Creating New Profile(4).
- To Create A Watch List, Publishing Your Trade Idea And Much More(5).
- For Sharing Your Study With Other Traders (6).
As You Can See, Trading View Has Lot To Offer In A Single Window, Also We Will Discuss Few Of this Feature In Detail, And Show You How You Can Use Trading View In Own Trading.
Creating Profile:
You Can Start Trading View By Creating A Profile For Your Chart Layout. In Profile, You Include Different Market That You Want To Monitor, This Make Your Trading More Organized.
Here Is Some Idea On How You Could Combine Different Market.
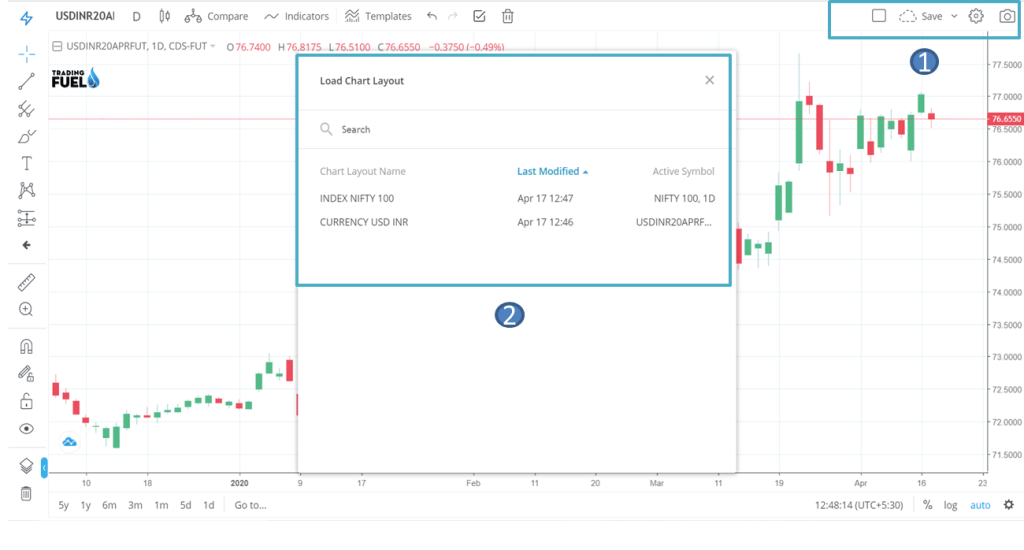
So When You Load Profile Index, You’d See All Yours Previously Used Chart For Nifty, Bank Nifty. Each Profile Is A Collection Of Different Chart And Market That You Can Easily Switch Between In Trading View.
You Can Create Profile As Guided In The Picture Below:
| Index | Currency | Commodities |
| Nifty | USDINR | Gold |
| Bank nifty | EURINR | Copper |
| GBPINR | Silver |
Chart Layout:
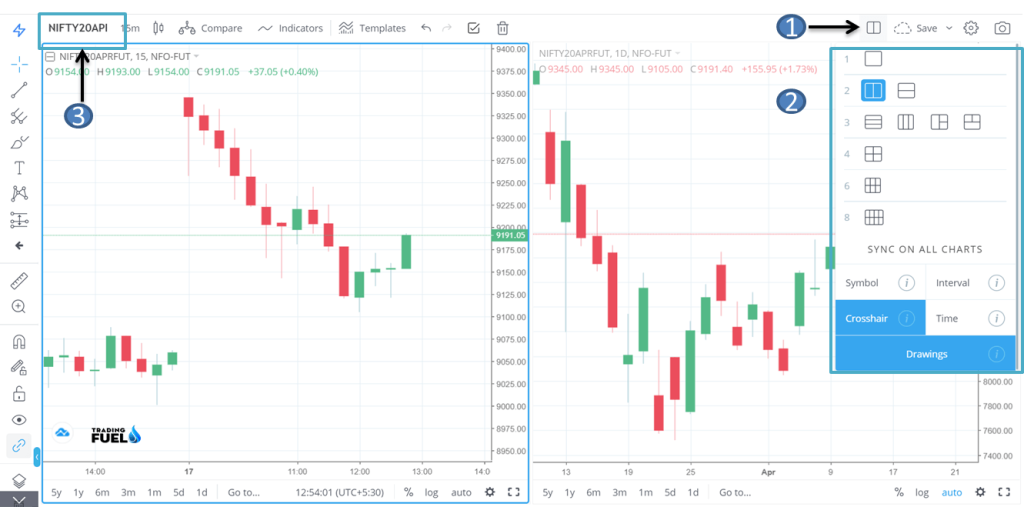
After Creating A Profile, Now We Will Look At The Layout Of Chart. Click On The (1) At Top Right Corner
And You Will See A Menu Slide Down From Here You Can See Multiple Chart At Same Time. This Is Very Use Full In Multi Time Frame Analysis Also If You Want To Analysis Multiple Charts Simultaneously.
Menu Overview:
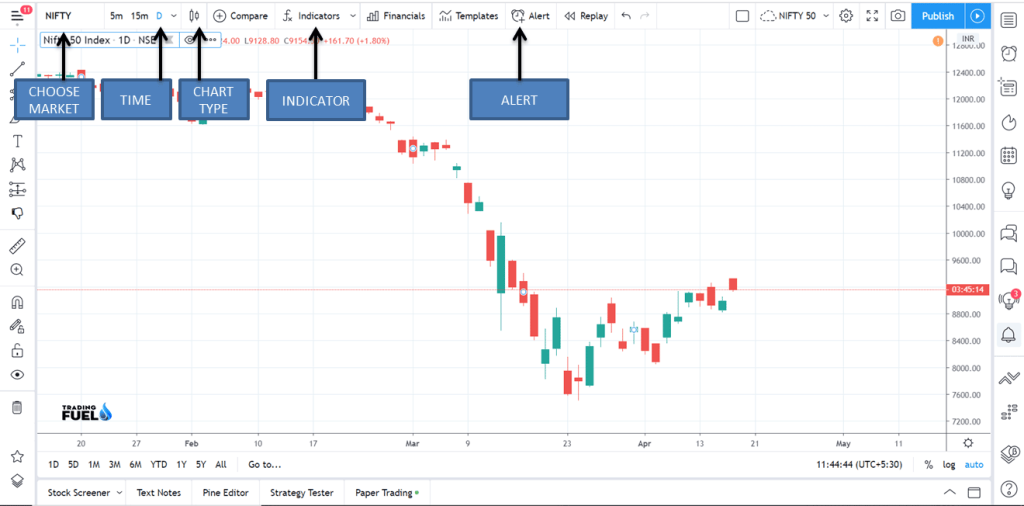
The Top Menu Has A Variety Of Different And Styling Feature. We, Will, Go One By One and Study Each One In Brief.
- CHOOSE THE MARKET: For Different Market (Currency, Index, Stock, Future, Etc.)
- TIME FRAME: For Different Time Frame of Chart (Monthly, Weekly, Daily, Hourly, Etc.)
- CHART TYPE: Different Chart Type (Bar, Candle, Hikenashi, Line)
- COMPARE: Allow You To Overlay Your Chart With Another Chart.
- INDICATOR: You Will Find All The Technical Indicators In This Section.
These Setting Will Be Saved In Your Different Profile And Chart Layout.
You Also Like: Best Technical Analysis Software
Market Overview:
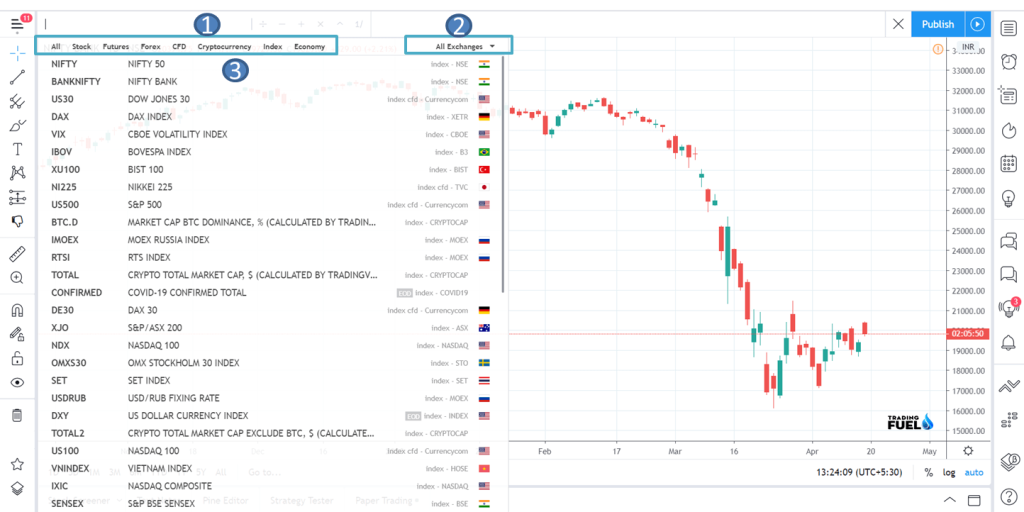
After Selecting A Input Field For The Market (1) You Will See A New Menu Here It Allow You To Select Your Desire Exchange. All Popular Exchanges Are Listed Here Form American Exchange To European Exchange, And Asian Exchanges, All Kind Of Tradable Asset Are Available Here Stock, Future, Commodity, Currency, Digital Coin Etc. Which Is Great If You Want to Perform Inter market Analysis.
Chart Types :
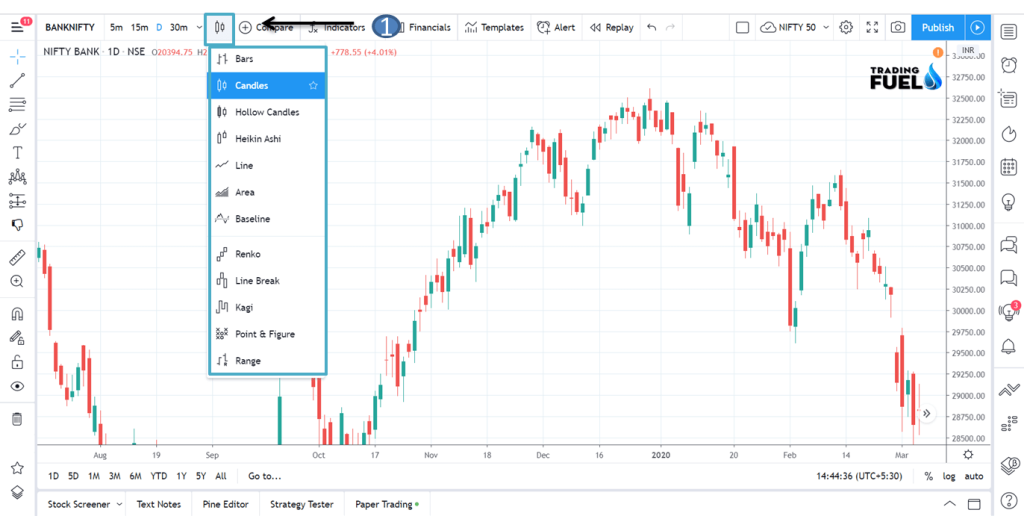
By Clicking The Candlestick Symbol At Top You Can Change Chart Type. As You Can See Trading View Offer, Wide Range From Regular Bar To Candlestick, Renko, Point And Figure And Even Kagi Chart.
Chart Setting:
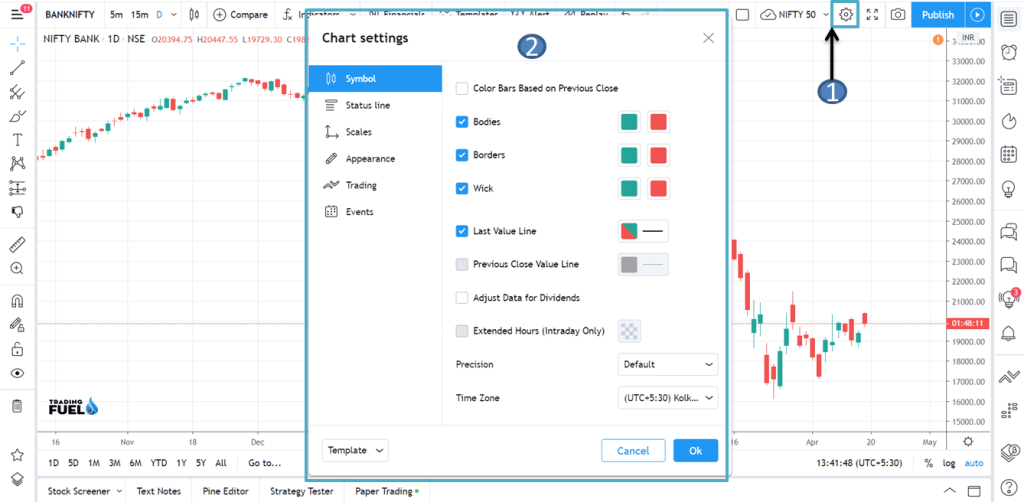
The Cog Symbol Allow You To Style Your Chart And Also Access Some More Advanced Feature To Personalize Your Trading View Experience.
Charting Menu and Tools

Trading View Chart And Price Analysis Menu Are Truly A State Of The Art Platform. You, Will, Find Trading View Chart Tools On Far Left Of Your screen. By Clicking And Expanding Each Icon You Will See Why Trading View Is So Popular Among Traders, Along with All The Standard Tools You Will Also Find A Variety Of Very Advanced Tool.
Some of The Most Commonly Tools Are
FIBONACCI:

Fibonacci’s Retracement Tool Is A Great Example For How Convenient And Advance Trading View Chart Tools Are, You Can Also Draw Fibonacci Extension, Add And Delete Certain Fibonacci Level, Also Colour Code Different Level.
PATTERN:
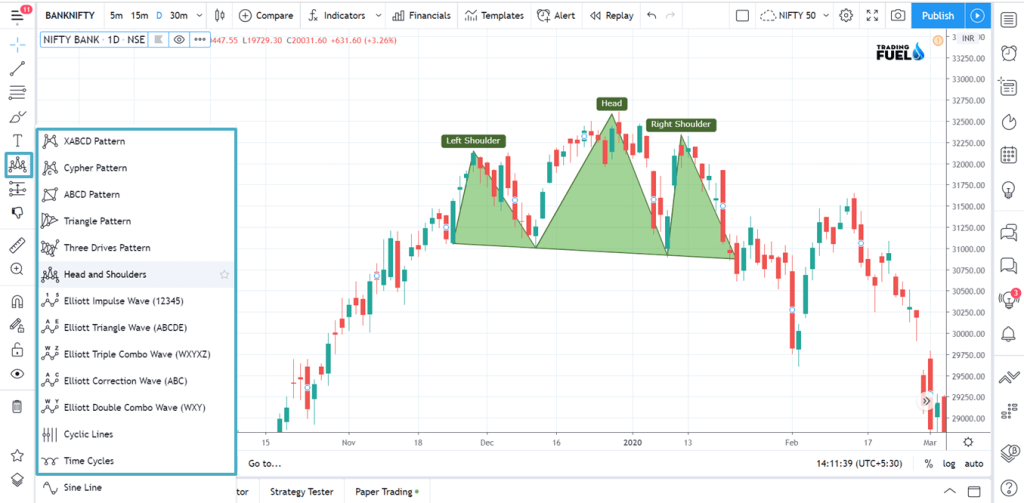
One Of The Great Feature Of TradingView Platform Is Ability To Draw Chart Pattern On Graph, Popular Pattern Like Head And Shoulder, Harmonic Pattern, Elliot Wave Impulse And Corrective Pattern Are Available Here And Many More.
CREATE YOUR MENUS:
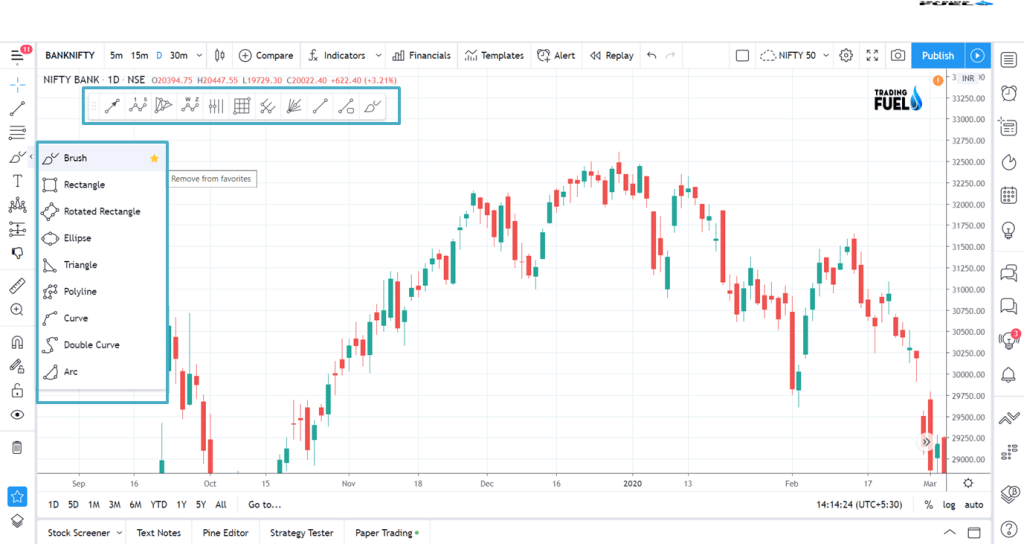
You Probably Don’t Want To Make Use Of So Many Different Tools And Charts, Most Traders Have Only 5 To 10 Favorite Chart Tool That They Make Use Of On Regular Basis, For This Trading View Is A Great Time Saver. You Can Create Your Own Personalized Tool Bar.
INDICATORS:
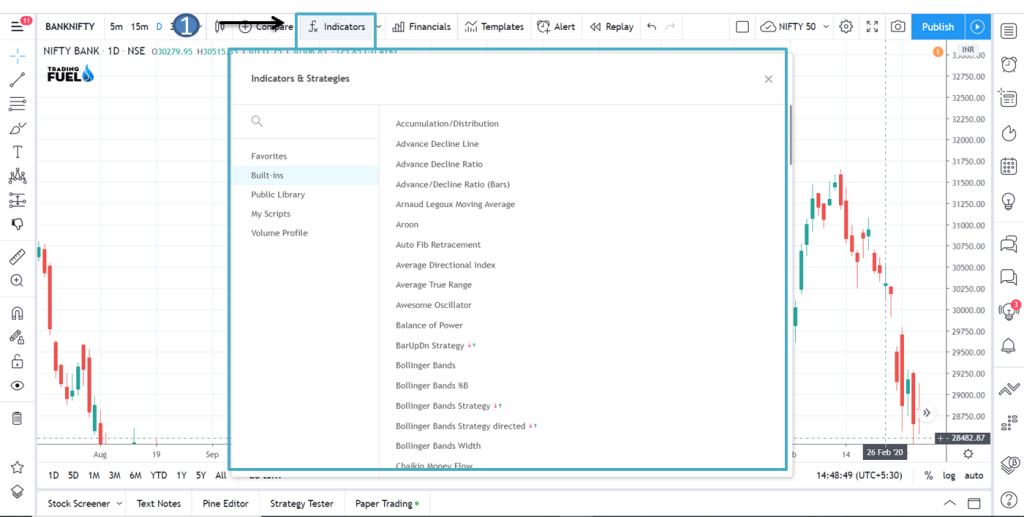
Trading View Also Comes With A Large Variety Of Indicator That You Can’t Find Else Where And Other Chart Tool. After Clicking Indicator Window, A New Popup Open And On The Left You Can See Different Categories:
Built-Ins Are Your Regular Indicator Such As The Moving Average, Rsi, Adx And Many More.Public Library Include Indicator That Has Been Created By Other Trading View Users.
CUSTOMIZING INDICATORS:
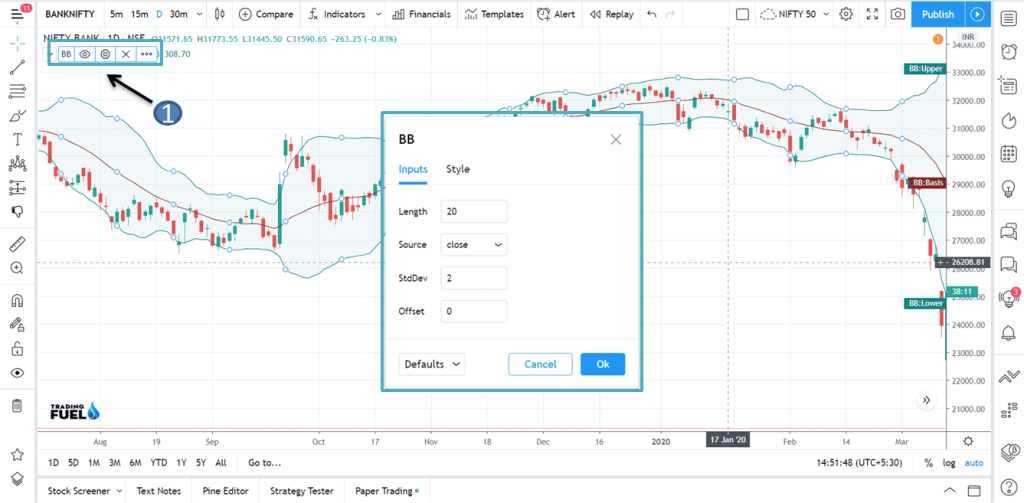
As You Can Customize The Way Your Chart Tool Look. You Can Also Change Setting For Your Indicators, Change Colour Specific Setting, Period Specific Setting And Many Other Things.
Aim Of This Blog Is To Assist You In Understanding The Depth Of Trading View Platform In Easiest Way Possible, It Allows You To Completely Personalize Your Chart And Setting At Same Time. Currently, Trading View Is Providing Most Advanced Chart And Tools, So Make Good Use Of It.