
(MFI)How to generate trading signals using the Money Flow Index?: Price and volume are considered to be the most basic but also essential indicators in technical analysis to predict the movement of prices.
To be able to take care of the price and volume data, we may use the Money Flow Index (MFI).
What is the Money Flow Index (MFI)?
- The Money Flow Index (MFI) is an oscillator that uses both price and volume to measure the buying and selling pressure on a financial instrument.
- MFI also measures the momentum in security after showing the inflow and outflow of money into the security over time.
- This index was created by Gene Quong and Avrum Soudack.
- This indicator is very much synonymous with volume-weighted RSI.
- The main reason for this is that it will integrate volume and, in terms of mathematical formulation and categorical classification as a momentum oscillator, will mirror the relative strength index (RSI).
- In short, MFI is a unique indicator that will combine momentum and volume with an RSI formula.
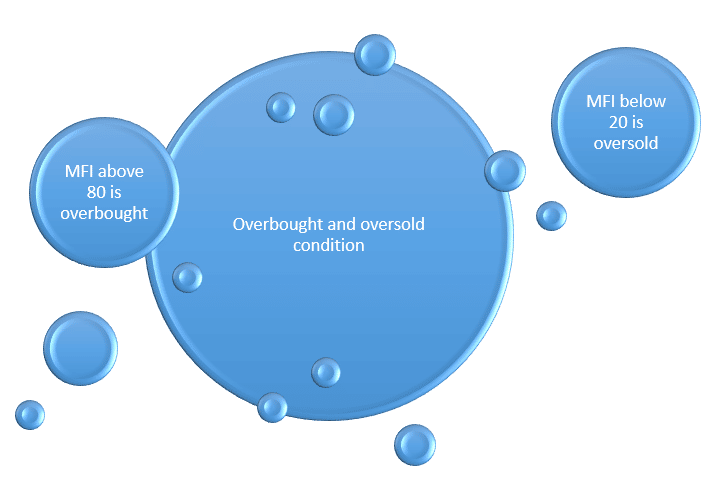
- The MFI is considered to be favoring the bull when the indicator is above 50 and bears when the indicator is below 50.

Don’t Forget To Check: Best Top 3 Intraday Trading Strategies
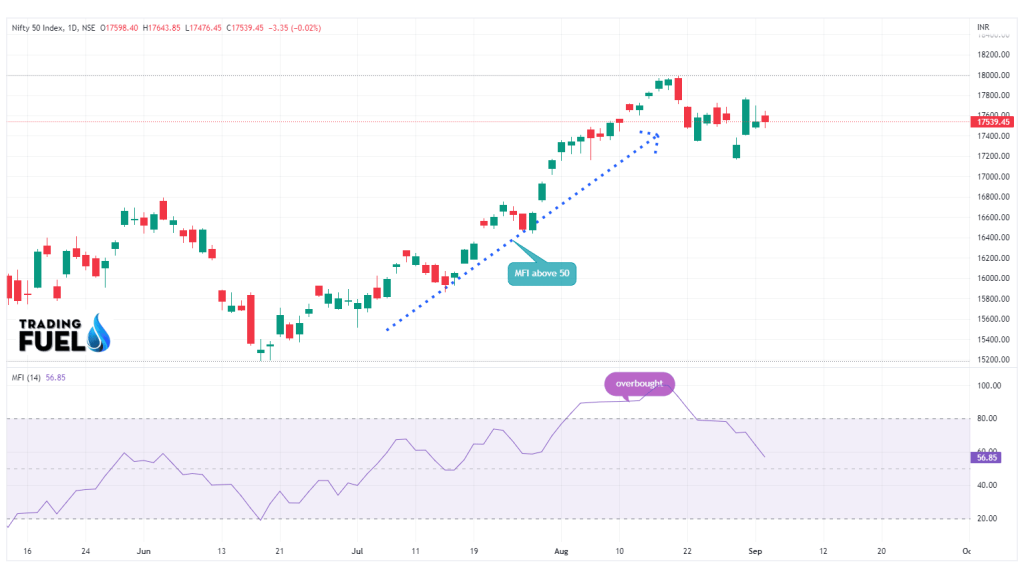
- Pattern analysis is combined with the MFI so as to increase signal robustness.
- The chart below depicts the MFI index on the Nifty 50 index:
Calculation of the Money Flow Index:
- The MFI is standardized on a 0 to 100 scale.
- The default period for this indicator is set to 14 periods and is usually applied to a daily chart, which is also the most popular time compression chart.
- Volume is often not kept on the charting platforms below the daily levels, and hence the MFI should be used on either the daily time compression or higher.
- The following are the main steps to calculating the Money Flow Index (MFI):
Know More About:Money Flow Index (MFI)
—>>Step One:
- Just like other indicators, MFI relies on the calculation of the typical price.
- The same is calculated as follows:
- Typical Price = (High price + Low price + Close price)/3
- Some other indicators that use the typical price include the Commodity Channel Index (CCI) and the Keltner channels.
—>>Step Two:
- After that, we will calculate the raw money flow, or simply the money flow, which is a function of both volume and typical price:
- Money Flow = Volume * Typical price
—>>Step Three:
- The next step is the ratio between the positive and negative money flow.
- The calculation for the same is as follows:
- Money Flow Ratio = (N-Day Positive Money Flow)/ (N-Day Negative Money Flow)
- Here, N equals the number of periods the indicator is set to.
- If you keep this indicator at the default setting, then N will be 14.
- Positive money flow is calculated after taking the sum of all the money flows on all the days on which the typical price of one day is higher than the previous day.
- Similarly, negative money flow is calculated after taking the sum of all money flows on the days on which the typical price of one day is below the prior day.
—>>Step Four:
- With the help of the above three calculations, the MFI can be found according to this formula:
- Money Flow Index = 100-100/ (1+ Money Flow Ratio)
- As mentioned above, the value that you will arrive at here will be between 0 and 100.
- It should be very precisely noted that on many charting platforms, volume data is not kept for the currency pairs.
- Without volume, the MFI will not plot on the charts accordingly.
Working of MFI Indicator:
- A divergence between the indicator and price is very important.
- There are two types of divergences that are helpful for trading purposes:

Must Know How To Select Stock In Intraday Without Indicators
Positive divergence indicates the signal to buy, whereas negative divergence indicates selling.
Correlation between the MFI and the RSI:
- MFI and RSI are very closely related.
- The main difference is that MFI will incorporate the volume but the RSI will not.
- MFI will also provide lead signals as well as warn of possible reversals in a more timely fashion at times that are ahead of RSI.
- Similar to RSI, the value of MFI will range between 0 and 100 and will also use a default setting of 14 periods for its own calculation.
- The MFI also has a very high correlation with the RSI but will differ to some extent as it will take into account the trading volume of the instrument.
Strategies using the Money Flow Index:
Case 1: When the price cuts above the 20 SMA from below and then simultaneously MFI also cuts above the 40 lines, which will generate the buy signal.
The chart for the same is as below:
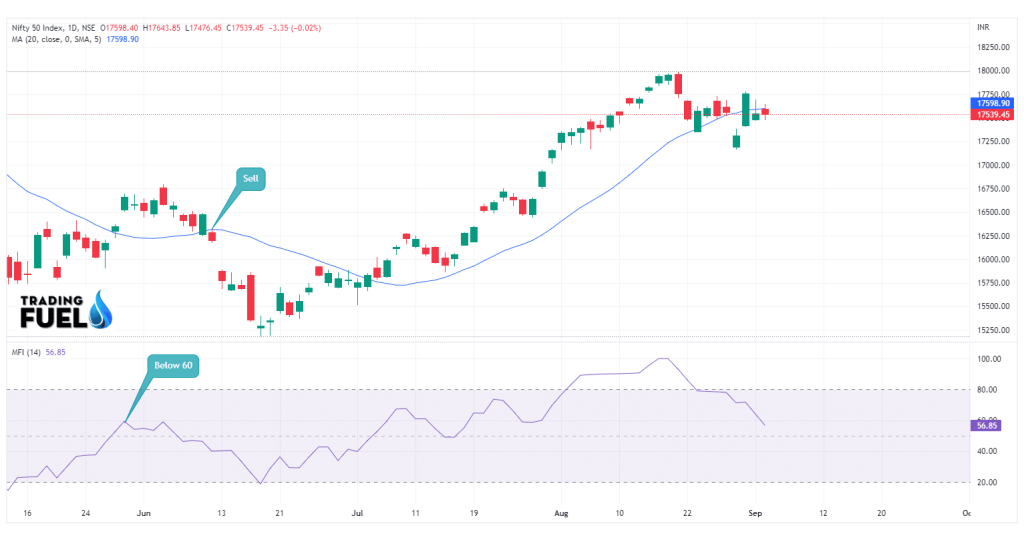
Case 2: When the price cuts below the 20 SMA from above and the MFI also cuts below the 60 lines, then it will generate the sell signal.
The chart for the same is as below:

Also Like:What Is Index Trading?
Conclusion:
We hope that the above blog gives you clarity about the ways to generate trading signals using the money flow index.
About Us:
Trading Fuel is our website for blogs where we provide you with knowledge about finance, economics, the stock market, and intraday trading. Stay tuned with us for more such curated blogs.