
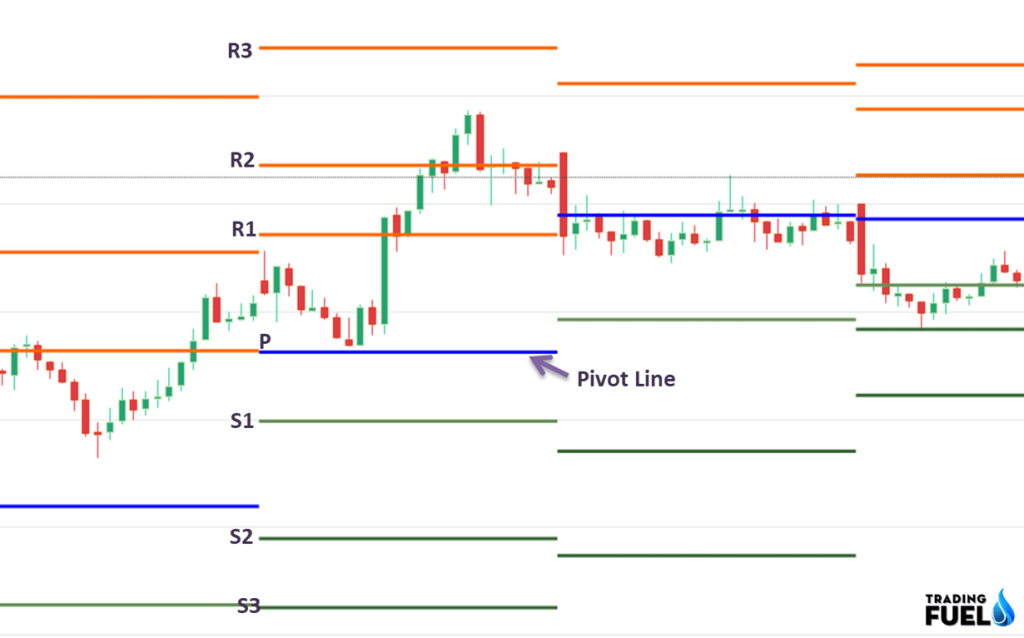
Pivot Points are leading price indicators and one of the most popular indicators used by day traders. A pivot point is a level of price that provides a specialized plot of support and resistance that helps traders to find an entry, exit, and stop-loss and it automatically plots daily. This technical instrument provides seven price levels, you can see in the below image.
How to Calculate Pivot Points
Pivot Point is a simple mathematic calculation designed to determine the range expansion based on previous data of time that includes high, low and the close price. Let’s see the formula of the pivot points.
- Pivot Point:
The Pivot Point (P) = Previous Period (High+ Low + Close)/3
- Resistance 1:
R-1 = (2 × Pivot Number – previous period low)
- Support Level 1:
S-1 = (2 × pivot number – previous period high)
- Resistance 2:
R-2 = (pivot point – support 1) + resistance 1
- Support 2:
S-2 = pivot point – (resistance 1 –support 1)
- Resistance 3:
R-3 = (pivot point – support 2) + resistance 2
- Resistance 4:
S-2 = pivot point – (resistance 2 –support 2)
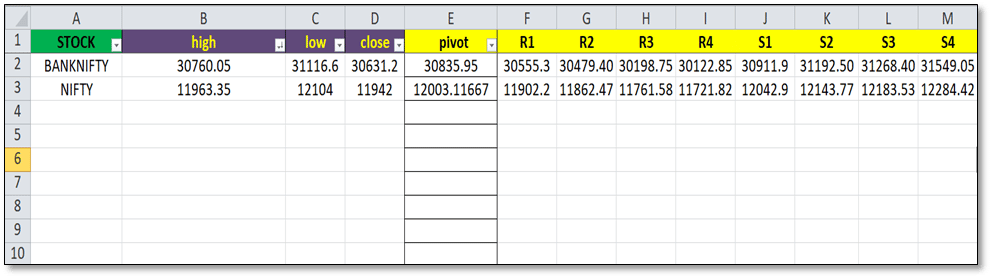
Pivot Point Calculator & Excel File
You can download Pivot Point Calculator Excel Sheet from here. Input high, low, close price of stock/index and you will automatically get Pivot, R1, R2, R3, S1, S2, & S3 levels.
This is the simple calculation of pivot point; now let’s understand how price reacts with these levels. R1, R2, R3 acts as resistance as the market rises. If the price moves up and goes above these levels, it also acts as the support. Same for the support levels S1, S2, S3 act as resistance during the bearish market condition.
- Pivot Point: It is the focal price level and it is the strongest of the support and resistance number. Price trade above or below this level before breaking the one direction or the other.
- When the price is above the pivot point, it is suggested to go for buy and if the price is below this level, look for sell.
- Resistance 1: During the low volatility session or in a consolidating trend or low volume, this level act as the high for particular day session.
- Resistance 2: This price level act as significant resistance and will provide an exit target for a buying position.
- Resistance 3: During the extreme bullish market condition, this level generally established by news-driven price shock or big events.
- Support level 1: When the price comes to this level, it tends to reverse at or near this level in the bullish trend of the market.
- Support level 2: The price takes significant support at or near this level when the market is in bearish condition. It is useful for booking profit at this level during the short trade.
- Support Level 3: Mostly price comes to this level when the market is extremely bearish because of big news or events. It acts as the support area or projected target low. From this support level, the price may reverse.
Also Learn: The Best Intraday Trading Indicators
How to Use Pivot Points?
As the pivot points are the leading indicator, traders can use this indicator to gauge the potential turning points. The levels can be used for entering into the or as the support or resistance or used for the stop-loss or profit booking levels.
For the use of a pivot point, the middle line (pivot line) is the main focus. If the price is above this level, the market sentiment might be remaining bullish for the day.
If the market is in consolidation, the price may range around the pivot point, and if the price starts moving below the pivot point, it is considered as the market will be in the downtrend for the day.
Pivot Point Trading Strategy For Intraday
In this part, you will learn about trading using the pivot points. First of all, let’s have a look at the rules for the strategy.
- The strategy for intraday trading with the pivot point is useful for Nifty and Bank Nifty only.
- You need Daily and 5-minute candlestick charts.
- If the price breaks the high of the previous day, we can get a buying opportunity for the next trading session.
- At the end of the day, if the price breaks the low of the previous candles, there is a short opportunity for the next day.
Let’s understand in detail for buy and sell trade.
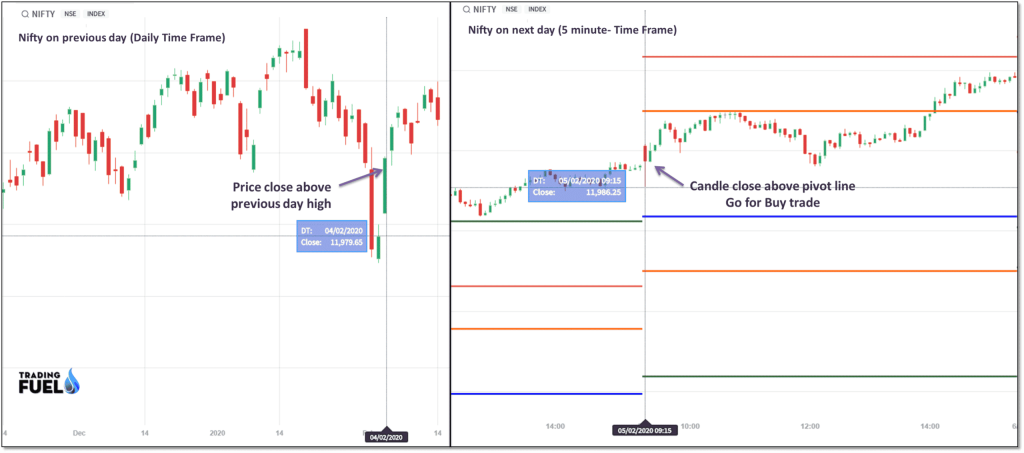
For Buy Trade:
- In a daily time frame, at the end of the day, watch the price should close above the previous day’s high.
- If you find the buy setup, On the next day then when market open, use 5-minute time-frame.
- Wait for the 5-min candle to close above the pivot point.
- Enter into the trade after completion of the candle and put stop-loss at the low of this candle.
- Maintain a 1:2 risk to reward ratio for targets.
Example:
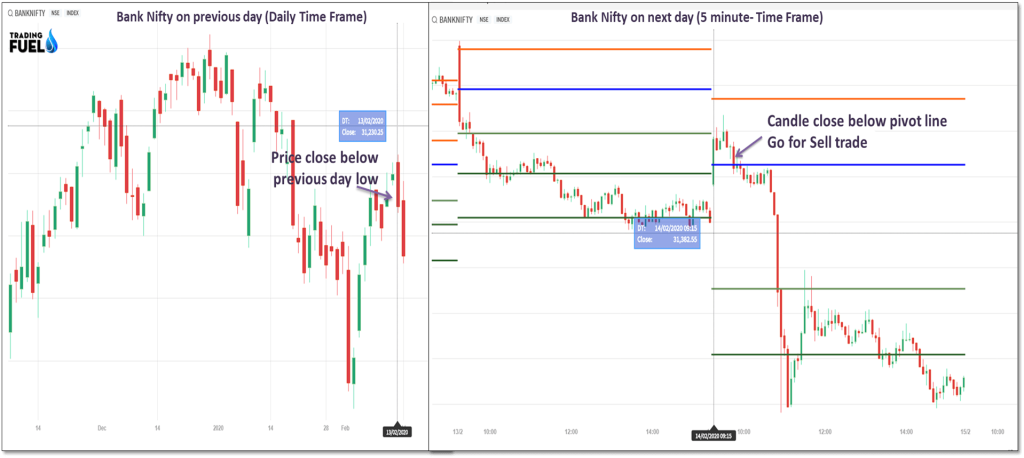
For Sell Trade:
- In a daily time frame, at the end of the day, watch that the price should close below the previous day’s low.
- If you find the sell setup, on the next day then when market open, use 5- minute time-frame.
- Wait for the 5-min candle to close below the pivot point.
- Enter into the trade after completion of the candle and put stop-loss at the high of this candle.
- Maintain a 1:2 risk to reward ratio for targets.
Example:
Benefits of using Pivot Points
- It is unique for intraday trading: This indicator uses the previous trading day data and applies it to the current trading day.
- This is the only indicator that shows the same levels, in a shorter time frame (from 1 to 15 min). I.e. if you use pivot points in 1, 5, 10 and 15 you will get the same pivot levels.
- It is one of the most accurate trading indicators; it helps traders to trade with the overall flow of the market.
Amibroker Pivot Point AFL
_SECTION_BEGIN("open afl");
SetChartOptions(0,chartShowArrows|chartShowDates);
_N(Title = StrFormat("{{NAME}} - {{INTERVAL}} {{DATE}} Open %g, Hi %g, Lo %g, Close %g (%.1f%%) {{VALUES}}", O, H, L, C, SelectedValue( ROC( C, 1 ) ) ));
Plot( C, "Close", ParamColor("Color", colorDefault ), styleNoTitle | ParamStyle("Style") | GetPriceStyle() );

D1 = Day()!=Ref(Day(),-1);
H1 = ValueWhen(D1,High,1);
L1 = ValueWhen(D1,Low,1);
C1 = ValueWhen(D1,Close,1);
O1 = ValueWhen(D1,Open,1);


H11 = TimeFrameGetPrice("H",inDaily,-1);
L11 = TimeFrameGetPrice("L",inDaily,-1);
C11 = TimeFrameGetPrice("C",inDaily,-1);


PP = (H11+L11+C11)/3;
MP = (H11+L11)/2;


x = BarIndex();
x1 = (BarCount -1);
xL = SelectedValue(ValueWhen((Day()!=Ref(Day(),-1)),x,1));
yy = Status( "pxchartheight" ) ;

if(Interval()<86400)
{
Plot(LineArray(xL,SelectedValue(PP),x1,SelectedValue(PP),1),"PP",colorCustom12,8|styleNoRescale,Null,Null);
Plot(LineArray(xL,SelectedValue(MP ),x1,SelectedValue(MP ),1),"MP ",colorOrange,8|styleNoRescale,Null,Null);

Plot(LineArray(xL,SelectedValue(H11),x1,SelectedValue(H11),1),"H11",colorBlue,8|styleNoRescale,Null,Null);
Plot(LineArray(xL,SelectedValue(L11),x1,SelectedValue(L11),1),"L11",colorRed,8|styleNoRescale,Null,Null);
Plot(LineArray(xL,SelectedValue(C11 ),x1,SelectedValue(C11 ),1),"C11 ",colorBlack,8|styleNoRescale,Null,Null);


}


_SECTION_END();
Disclaimer: The main purpose of this blog is to provide knowledge on pivot points. Our strategy with pivot point gives 35% accuracy only. Do back-test by yourself before using our strategies. We are not responsible for your profit and loss.