Best Intraday Trading Formula – Trading Fuel:
The entire trade is based on a formula.
Intraday trading is nothing but buying and selling securities on the very same day.
What is Intraday Trading?
- Intraday trading is a trading option wherein the trade deals are executed within a day and do not have any nightly ownership.
- It is considered to be a very high-frequency trading.
Intraday Trading Formula:
Intraday trading is based on a formula.
The following are the main formulas used for intraday trading:
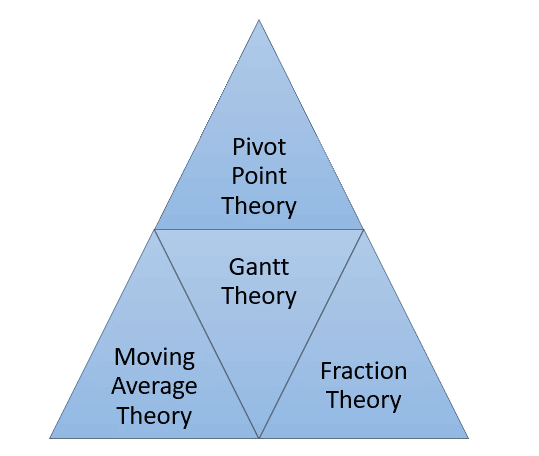
#1. Pivot Point Theory:
- Pivot Point Theory is a very powerful intraday trading formula.
- It will foresee the development of a stock that is dependent on the performance of the stock on an earlier day.
- This theory will help you gain access to the earlier day’s trading information of stock.
- The main inputs generated here are:
- Intraday High (H),
- Intraday Low (L), and
- Closing Price (C).
The formula for the same is:
H+L+C = X
This derived value of ‘X’ has to be divided by 3, which will give you the value of the turning point (P):
X/3 = P (turning point).
Next, you will have to multiply the P by 2:
X/3 * 2 = Y
- Here, it is expected that the stock that is moving over to the turning point is probably going to proceed with its excursion till the main resistance point.
- Similarly, a stock that is trading below the turning point will first float lower to the principal support level and will then proceed to the subsequent support level.
First Resistance Level (R1): Y – L
Second Resistance Level (R2): P + (H-L)
Similarly, we can also ascertain the support levels in the following ways:
First Support Level (S1): Y – H
Second Support Level (S2): P – (H-L)
Don’t Forget to Check: Top 3 Intraday Trading Strategies
#2. Gantt Theory:
- The Gantt Theory was developed by Henry Gantt.
- It is a chart-based theory.
- It is a horizontal bar chart that was developed as a production control tool in 1917.
- This chart is frequently used in project management and it also provides a graphical illustration of a schedule that can be used to plan, coordinate, and track tasks in a project.
- These charts are simple versions that can be created on graph paper or some more complex automated versions that are created using project management applications such as Excel, etc.
- The following are the main steps to developing a Gantt chart:
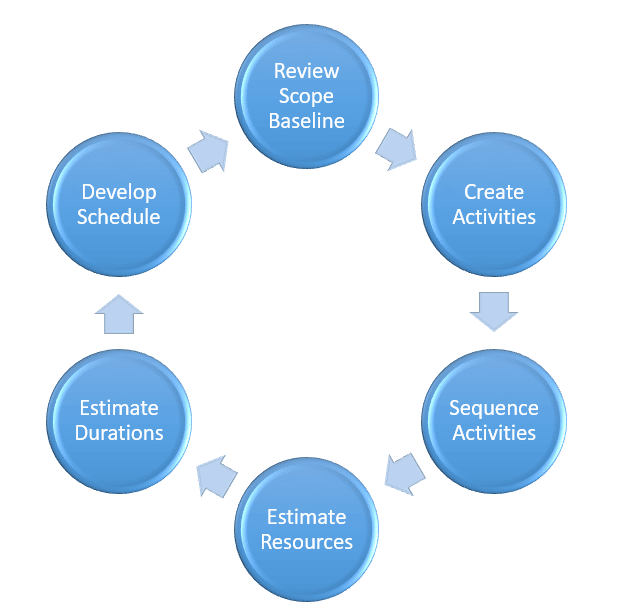
Step 1: Review Scope Baseline:
You will have to gather a team and review the approved scope baseline, which consists of the following three components:
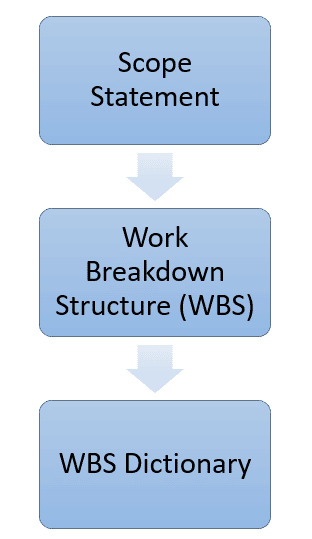
This project team member should confirm that the scope baseline addresses 100% of the project scope.
Step 2: Create Activities:
- With the technique of decomposition, the project team will break down each WBS work package into activities.
- The team will need to set the rules for creating the scheduled activities simply by creating the WBS work packages.
- The final schedule has to be the one that is effective as well as efficient.
- It is also very important to identify the deadlines as well as the milestones while decomposing the project.
Don’t Forget to Check: Top 10 Intraday Trading Techniques
Step 3: Arrange Activities:
- Every activity in a company is interlinked with one another.
- Also, every activity, apart from the first and last, has a relationship with either its predecessor or its successor.
- Through sequencing activities, we will place the activities in the right order using the right relationships.
- There are four types of relationships here:
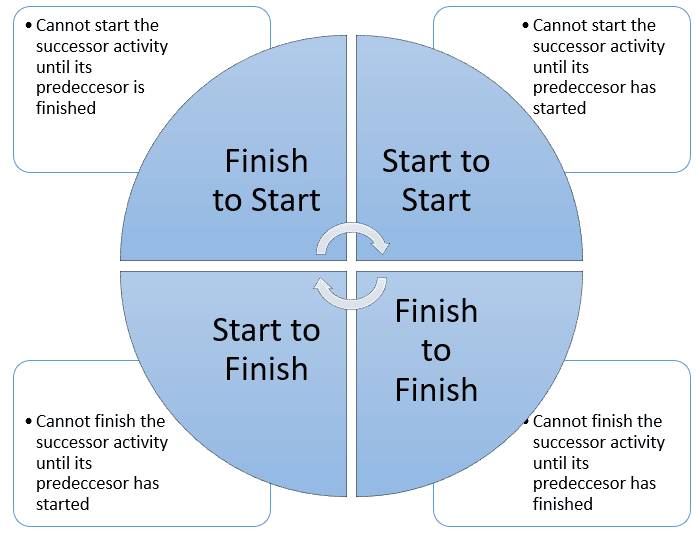
- The first and second relationships are commonly used.
- Whereas finish to start is a sequential relationship and the start to start is a parallel or overlapping relationship.
Step 4: Estimate Resources:
- Before estimating the duration, you will have to identify and estimate the resources.
- Resources will include labor, materials, and equipment.
- After estimating the resources, they should be loaded into the schedule against the respective activities.
- A resource calendar is developed to show when the resources will be needed or made available.
Step 5: Estimate Duration:
- Duration is basically the time between the start and end of an activity.
- Here, you will have to review the resources, relationships, and sequencing, and then estimate the duration for each such activity.
- The same technique that is used for estimating the resources can be used for estimating the durations.
Step 6: Develop Schedule:
- Lastly, you will have to create a Gantt chart by loading all the information into a project management software tool.
- Then, review and approve the schedule.
- The approved Gantt chart schedule will then become the schedule baseline.
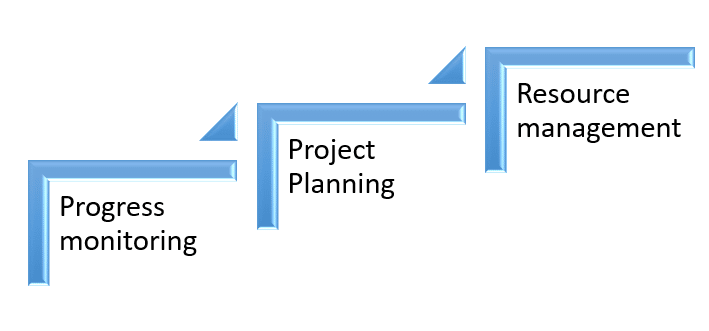
- The Gantt charts are used for the following purposes:
Also Read: Pivot Point Trading Strategy & Calculator
#3. Moving Average Theory:
- A moving average is commonly used in capital markets and can be defined as a series of a mean that is derived from a successive period of numbers or values.
- The same would be calculated continually once the new data is available.
- This is the trend-following indicator and would be based on previous numbers.
- The formula for the moving average is:
Moving Average: C1+C2+C3+…. +Cn
N
In this case, C1, C2, and Cn represent the closing price, numbers, or balances, and
N stands for the number of periods for which the average is required to be calculated.
For More Detail: How to Use Moving Average in Intraday?
#4. Gann Theory:
- The Gann theory was developed by William D. Gann.
- It was developed in the 1900s.
- This theory was developed because, according to William, stock prices change at an angle.
- He also noticed that the price changes were closely related to natural geometric shapes and, through this, also predicted the future price movements in relation to time.
- This is the main reason that the Gann theory is also called the Gann Angle theory.
What are the Gann Angles?
- Gann believed that each angle and pattern has a distinct characteristic that can be used to forecast price action.
- His charts use the same time and price interval.
- For Gann, the rise and run of 1*1 will always equal 45 degrees.
- He also states that the price and time are at their very best when the stock will rise or fall at a 45-degree angle, which is also relative to each other.
- To draw his angles, you will need a significant top or bottom.
- If the prices are above the trend line, then it is a bullish market; if the prices are below the trend line, then it is a bearish market.
- He also believed that the 1*1 trend line will provide major support and resistance in an up-trend and that this will be when it will break and will signal a major reversal trend.
- He identified the following 9 angles, where the most important one is 1*1:
| Angles | Degrees |
| 1*8 | 82.5 |
| 1*4 | 75 |
| 1*3 | 71.25 |
| 1*2 | 63.75 |
| 1*1 | 45 |
| 2*1 | 26.25 |
| 3*1 | 18.75 |
| 4*1 | 15 |
| 8*1 | 7.5 |
Application of Gann theory:
The Gann theory can be applied in the following ways:
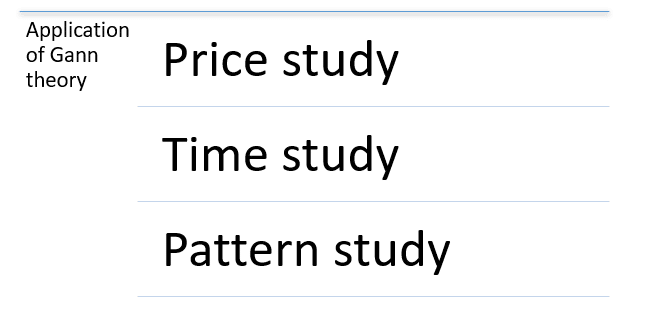
Price study:
With this, you will be able to track the price movements of the stocks, and the pivot levels are used to predict the future price movements of the stocks.
Time study:
This time study model will give the traders an idea of when the value of the stock will reverse.
It is also essential to analyze the historical data and then determine the current stock price.
Pattern study:
The use of patterns will aid in locating stock movements as well as investor activity.
For More Detail: Gann Theory
#5. Fraction Theory:
- This theory is very much like the Pivot theory.
- It is a mainstream intraday trading formula that is dependent on inputs gathered from the past trading day.
- In this theory, the earlier day’s high (H), low (L), and closing (C) should be included and increased by 0.67 as follows:
(H+L+C) * 0.67 = Y
- The resistance and support levels here are determined in a similar way to that of the pivot point theory.
- The conceivable purchases of the stock (PB) are Y – C.
- Once you get the stock PB, you can go for resistance levels.
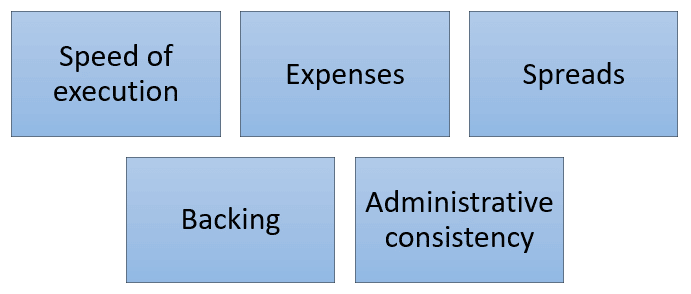
Intraday Stock Trading Strategies:
The following are the main stock trading strategies:
Don’t Forget to Check: How to Select Stocks for Intraday Trading?
Speed of execution:
Speed of execution should play a role due to the high number of exchanges you will make in a day.
Expenses:
The lower the fees and commission, the more benefit you will bring home, and eventually, this will lessen their bonus for the more you exchange.
Spreads:
As a day trader, you will need to request serious spreads and discover brokers with tight spreads.
Backing:
With whatever your day trading technique, you might end up needing an online broker with speedy reaction as well as solid customer care.
Administrative consistency:
You will have to make sure that your broker is managed and that they will lawfully be required to secure all your monetary advantages.
Conclusion:
We hope that the above blog gives you an idea of the best intraday trading formulas. Apart from the above, there are other formulas such as the 2652 theory of trading, support, and resistance theory, etc.
About Us:
Trading Fuel is our website for blogs where we give you knowledge about the stock market, intraday trading, and technical analysis. Stay tuned with us for more such blogs.